Authors Subhadip Nandy
7 days
30 days
All time
Recent
Popular

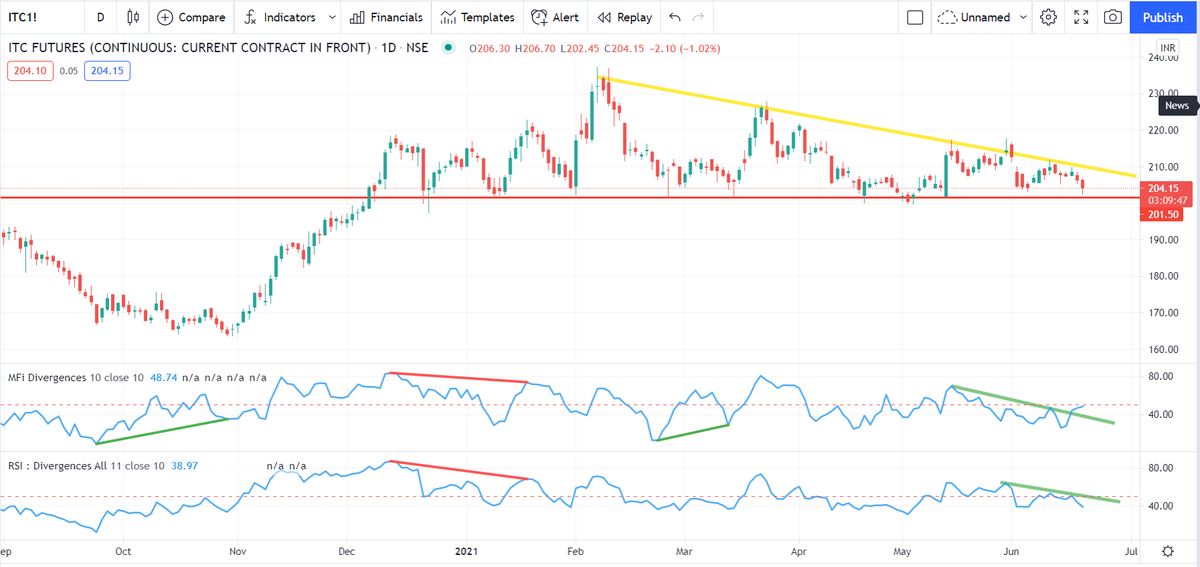
Two year back thread on MFI, someone liked this so came up in notifications . Rather than running around 100s of indicators, I have made this my go to indicator under any circumstances and have been using this for years
This thread actually had some great answers , one can learn a lot about the thought processes of different traders from the answers. Please go thru them
What do you think/use as the most robust leading indicator if following technical analysis ? Please answer with reason , I will provide my answer after 2 hours
— Subhadip Nandy (@SubhadipNandy16) August 12, 2019
( At Delhi airport , bored as hell )
This thread actually had some great answers , one can learn a lot about the thought processes of different traders from the answers. Please go thru them
Ok here is the explanation. Grab a cup of coffee and read on. If you have not read/noticed this, you will see intraday options movement in a new light.
Say we have two options, one 50 delta ATM options and another 30 delta OTM option. Normally for a 100 point move, the ATM option will move 50 points and the OTM option will move 30 points. But in a high volatile environment, the OTM option will also move nearly 50 points
To understand why this happens, first understand why an ATM option is 50 delta. An ATM option has the probability of 50% of expiring as ITM. The price just has to close a rupee above the strike for the CE to be ITM and vice versa for PEs
Now think of a highly volatile day like today. If someone is asked where the BNF will close for the day or expiry, no one can answer. BNF can close freakin anywhere, That makes every option of an equal probability of being ITM. So all options have a 50% probability of being ITM
Hence, when a huge volatile move starts, all OTM options behave like ATM options. This phenomenon was first observed in the Black Monday crash of 1987 at Wall Street, which also gave rise to the volatility skew/smirk
In a high IV environment or when the market is very volatile
— Subhadip Nandy (@SubhadipNandy16) January 21, 2022
" OTM options will behave like ATM options", one will get almost the same delta movement
Say we have two options, one 50 delta ATM options and another 30 delta OTM option. Normally for a 100 point move, the ATM option will move 50 points and the OTM option will move 30 points. But in a high volatile environment, the OTM option will also move nearly 50 points
To understand why this happens, first understand why an ATM option is 50 delta. An ATM option has the probability of 50% of expiring as ITM. The price just has to close a rupee above the strike for the CE to be ITM and vice versa for PEs
Now think of a highly volatile day like today. If someone is asked where the BNF will close for the day or expiry, no one can answer. BNF can close freakin anywhere, That makes every option of an equal probability of being ITM. So all options have a 50% probability of being ITM
Hence, when a huge volatile move starts, all OTM options behave like ATM options. This phenomenon was first observed in the Black Monday crash of 1987 at Wall Street, which also gave rise to the volatility skew/smirk
My presentation on Money Management was based on a lot of sources as I mentioned. For traders interested on those sources , here they are
#OptimalF
Portfolio Management Formulas: Mathematical Trading Methods for the Futures, Options, and Stock Markets by Ralph Vince
The Mathematics of Money Management: Risk Analysis Techniques for Traders by Ralph Vince
#SecureF
#FixedRatio
The Trading Game: Playing by the Numbers to Make Millions by Ryan Jones
https://t.co/U0c65EbEog.
Time I retweeted this 😃
IV - A thread
— Subhadip Nandy (@SubhadipNandy16) September 20, 2018
In financial mathematics, implied volatility of an option contract is
that value of the volatility of the underlying instrument which, when
input in an option pricing model ) will return a theoretical value equal to the current market price of the option (1/n)
IV - A thread
In financial mathematics, implied volatility of an option contract is
that value of the volatility of the underlying instrument which, when
input in an option pricing model ) will return a theoretical value equal to the current market price of the option (1/n)
Implied volatility, a forward-looking and subjective measure, differs
from historical volatility because the latter is calculated from known
past returns of a security. .
https://t.co/iC5wVf7kvj (2/n)
To understand where Implied Volatility stands in terms of the underlying, implied volatility rank is used to understand its implied volatility from a one year high and low IV.
https://t.co/NFPOidRRcH
https://t.co/qNqinEqaKY
(3/n)
Options traders are always looking at the IV and IVR/IVP. For option
buyers, a low IV environment is best to initiate positions as the
subsequent rise in IV actually helps their positions . Even if the IV
remains flat, the position is not hurt by volatility (4/n)
Option sellers on the other hand are looking for high IV scenarios, where
the subsequent fall in IV ( known a vol crush , most often seen after
earnings/events) helps their positions. Here also, if the IV does not
rise, it does not hurt a seller's positions (5/n)
Perhaps you have the idea that calling me " 1 lot Nandy" is somehow derogatory and a easy poke at me. Allow me to explain why I look at this moniker as a badge of honour
I have traded 1 lot continuously twice in my life. The first in 2003 after I blew up on my INFY trade. I traded 1 lot ACC fut consistently and made 50k in a month
The 2nd time in 2013. When I suffered continuous losses for 5-6 months due to a variety of psychological issues. Then I traded 1 lot Nifty options consistently for 3 months. After that 2 lots for next 1 month and slowly increased
I have shared these two incidents on my various interveiws and regularly share this in detail with my handholding students when I talk about trading psychology.
This logic of trading 1 lot to iron out trading issues I learnt from the interview of Anthony Saliba, who traded 1 lot in options for 6 months. BTW, Saliba was the only options trader to have been profiled on the original Market Wizards ( I read his interview and used his logic)
Sir itseems people call you as "one lot Nandy".. Is it true?
— Bittu (@nanoobittu) July 16, 2021
I have traded 1 lot continuously twice in my life. The first in 2003 after I blew up on my INFY trade. I traded 1 lot ACC fut consistently and made 50k in a month
The 2nd time in 2013. When I suffered continuous losses for 5-6 months due to a variety of psychological issues. Then I traded 1 lot Nifty options consistently for 3 months. After that 2 lots for next 1 month and slowly increased
I have shared these two incidents on my various interveiws and regularly share this in detail with my handholding students when I talk about trading psychology.
This logic of trading 1 lot to iron out trading issues I learnt from the interview of Anthony Saliba, who traded 1 lot in options for 6 months. BTW, Saliba was the only options trader to have been profiled on the original Market Wizards ( I read his interview and used his logic)