Implied volatility, a forward-looking and subjective measure, differs
from historical volatility because the latter is calculated from known
past returns of a security. .
https://t.co/iC5wVf7kvj (2/n)
To understand where Implied Volatility stands in terms of the underlying, implied volatility rank is used to understand its implied volatility from a one year high and low IV.
https://t.co/NFPOidRRcH https://t.co/qNqinEqaKY (3/n)
Options traders are always looking at the IV and IVR/IVP. For option
buyers, a low IV environment is best to initiate positions as the
subsequent rise in IV actually helps their positions . Even if the IV
remains flat, the position is not hurt by volatility (4/n)
Option sellers on the other hand are looking for high IV scenarios, where
the subsequent fall in IV ( known a vol crush , most often seen after
earnings/events) helps their positions. Here also, if the IV does not
rise, it does not hurt a seller's positions (5/n)
IVR and IVP help both parties to understand where the IV is standing
relative to the last one year OR six months. Based upon IVR/IVP , these
parties initiate their respective strategies. (6/n)
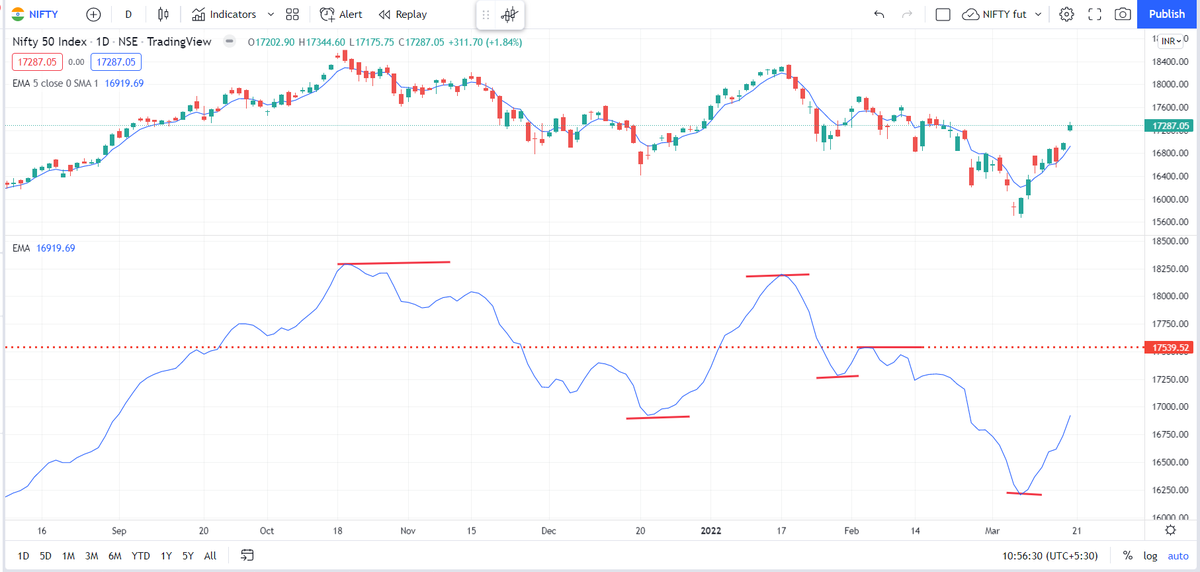
Now we come to the problem which I have faced in using IVR/IVP. See the
attached chart of SBI with IV ( chart taken from
https://t.co/uqGUOSVFb5).
The recap day lead to a huge spike in IV. As a result the IVR post the
movevnent will be skewed for the next 6 months. Even a normally high IV (
historically) will have a low IVR due to this spike, which basically is an
outlier (7/n)
Post the 6 month or 1 year timeframe used to calculate the IVR, the day in
which that spike day goes out of calculation, the whole IVR scenario
changes. What was a high IV environment can become a very low IV
environment in a single day ( due to dropping off that spike data)
One can argue that one can drop of the spike day IV value and thus check
the IVR. But what distinguishes an outlier ? Is there any objective measure
which takes care of this ?
Is there a way in which from the very next day of the spike, I can statistically determine high or low IV keeping the high spike day in consideration ?
Using Data Science : The #BoxPlot ( 10/n)
In descriptive statistics, a #BoxPlot is a method for graphically depicting groups of numerical data through their quartiles. #BoxPlot may also have lines extending vertically from the boxes (whiskers) indicating variability outside the upper and lower quartiles,
hence the terms box-and-whisker plot and box-and-whisker diagram. Outliers may be plotted as individual points. #BoxPlot are non-parametric: they display variation in samples of a statistical population without making any assumptions of the underlying statistical distribution.
The spacings between the different parts of the box indicate the degree of dispersion (spread) and skewness in the data, and show outliers.
https://t.co/O536rZS0AE (12/n)
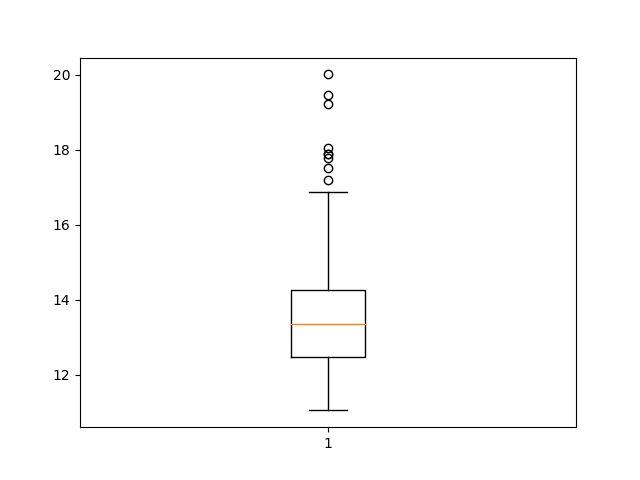
See the picture below for a simple explantion. This is a #BoxPlot of NSE VIX , uses data of the last one year. What this #BoxPlot says is :
1. The red line is the median value, with 50% of all observations above and 50% below
2. VIX above 17 is wild wild west where anything can happen, both buyers and sellers should be very very careful (13/n)
3. The lowest quartile 12.5 and below. Sellers will be at a disadvantage in initiating their strategies here. This is options buy strategies market
4. The topmost quartile 14.5-17 is where one can initiate selling strategies, buying strategies obviously will be at a disadvantage
This explanation will vary in individual stocks ( different IV regime), but we will get statistically valid zones to determine what kind of strategies should we deploy. Infinitely more rpeferable than flying blind. And the #BoxPlot solves the IV spike problem (15/n)
A link to understand the maths behind how the box plot is created and how to interpret :
https://t.co/e3PsZvMt0X (16/n)
No normal charting software has the facility to create BoxPlot charts. This chart has been generated using python. My next project is forecasting volatility and how IV moves between the different quartiles of a #BoxPlot
-------------------END -------------------