
https://t.co/JIO9Ou2NtQ
A small thread on intraday support resistance logics over time
The most common is Pivot , support and resistances calculated from the previous day's data
https://t.co/ILMjMay1zc
They can be calculated for daily, weekly, monthly etc.
https://t.co/JIO9Ou2NtQ
What struck me was that in each of the cases , we were using the OHLC and doing some maths with a multiplier/divider which WE/the trader thought fits the price action of the markets
Now the problem is, what has worked on the past set is on the past set. There is no guarantee that it will work in the future. As markets change, what do we do ?
A few lines of code on python can do this ( choosing some X period of backdata, identifying the best fit and applying them the next day).
Hence I started posting on twitter
More from Subhadip Nandy
Ok here is the explanation. Grab a cup of coffee and read on. If you have not read/noticed this, you will see intraday options movement in a new light.
Say we have two options, one 50 delta ATM options and another 30 delta OTM option. Normally for a 100 point move, the ATM option will move 50 points and the OTM option will move 30 points. But in a high volatile environment, the OTM option will also move nearly 50 points
To understand why this happens, first understand why an ATM option is 50 delta. An ATM option has the probability of 50% of expiring as ITM. The price just has to close a rupee above the strike for the CE to be ITM and vice versa for PEs
Now think of a highly volatile day like today. If someone is asked where the BNF will close for the day or expiry, no one can answer. BNF can close freakin anywhere, That makes every option of an equal probability of being ITM. So all options have a 50% probability of being ITM
Hence, when a huge volatile move starts, all OTM options behave like ATM options. This phenomenon was first observed in the Black Monday crash of 1987 at Wall Street, which also gave rise to the volatility skew/smirk
In a high IV environment or when the market is very volatile
— Subhadip Nandy (@SubhadipNandy16) January 21, 2022
" OTM options will behave like ATM options", one will get almost the same delta movement
Say we have two options, one 50 delta ATM options and another 30 delta OTM option. Normally for a 100 point move, the ATM option will move 50 points and the OTM option will move 30 points. But in a high volatile environment, the OTM option will also move nearly 50 points
To understand why this happens, first understand why an ATM option is 50 delta. An ATM option has the probability of 50% of expiring as ITM. The price just has to close a rupee above the strike for the CE to be ITM and vice versa for PEs
Now think of a highly volatile day like today. If someone is asked where the BNF will close for the day or expiry, no one can answer. BNF can close freakin anywhere, That makes every option of an equal probability of being ITM. So all options have a 50% probability of being ITM
Hence, when a huge volatile move starts, all OTM options behave like ATM options. This phenomenon was first observed in the Black Monday crash of 1987 at Wall Street, which also gave rise to the volatility skew/smirk
My presentation on Money Management was based on a lot of sources as I mentioned. For traders interested on those sources , here they are
#OptimalF
Portfolio Management Formulas: Mathematical Trading Methods for the Futures, Options, and Stock Markets by Ralph Vince
The Mathematics of Money Management: Risk Analysis Techniques for Traders by Ralph Vince
#SecureF
#FixedRatio
The Trading Game: Playing by the Numbers to Make Millions by Ryan Jones
https://t.co/U0c65EbEog.
#OptimalF
Portfolio Management Formulas: Mathematical Trading Methods for the Futures, Options, and Stock Markets by Ralph Vince
The Mathematics of Money Management: Risk Analysis Techniques for Traders by Ralph Vince
#SecureF
#FixedRatio
The Trading Game: Playing by the Numbers to Make Millions by Ryan Jones
https://t.co/U0c65EbEog.
More from Finance


Inflation is coming, inflation is coming!
Last month I wrote about the distinction between long-term secular inflation and shorter-term cyclical inflation
It has been clear for several months that we are in the middle of a cyclical rise in
The full thread can be reviewed here:
Today's PPI report should have been expected to surprise to the upside as the leading indicators of inflation have been screaming to the upside for months!
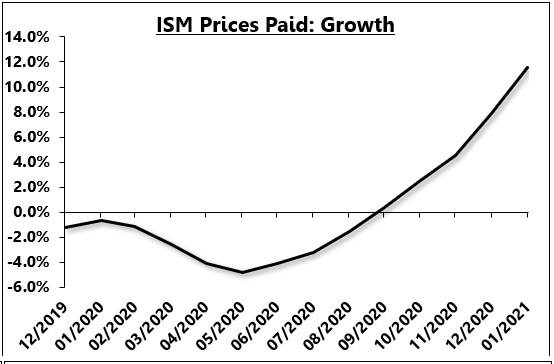
Here is the ISM prices paid index, cumulated into a growth rate
3/
Industrial commodity prices have also seen a major acceleration for months.
4/
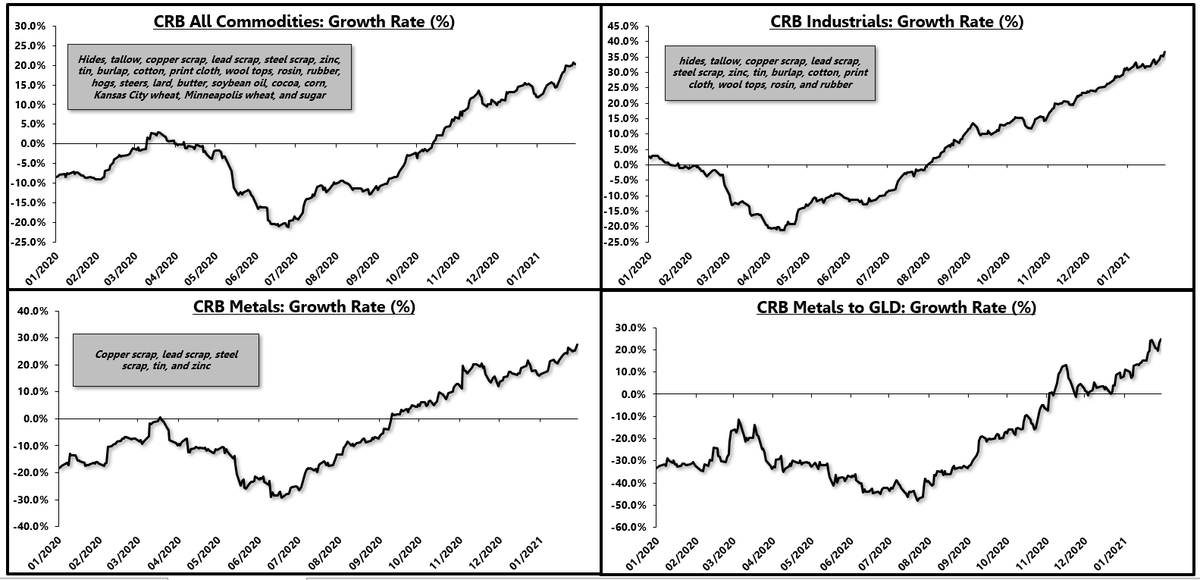
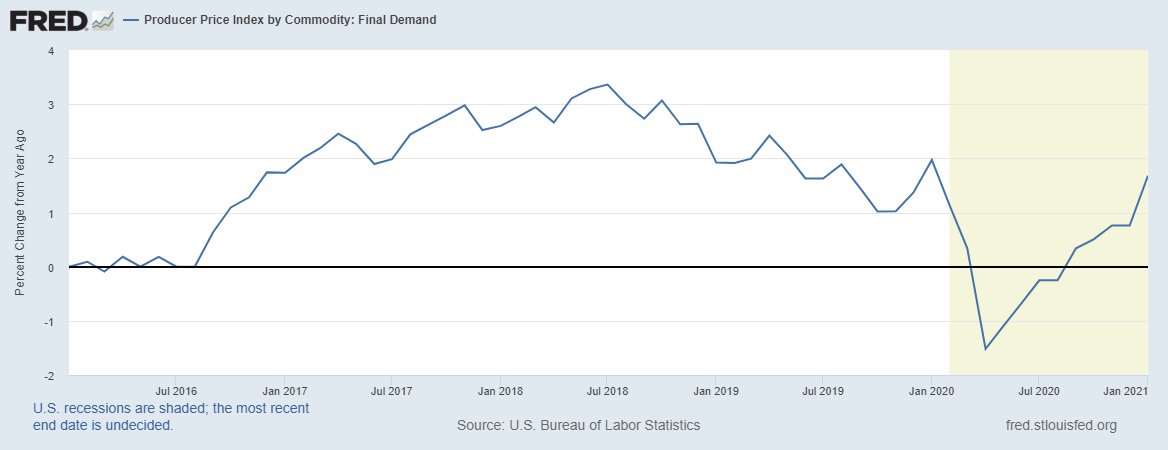
So today's PPI report was in line with the leads, suggesting that we have a cyclical upturn in inflation that is * primarily concentrated in the manufacturing sector *
This is a key point.
5/
Last month I wrote about the distinction between long-term secular inflation and shorter-term cyclical inflation
It has been clear for several months that we are in the middle of a cyclical rise in
Now, in the short-term, the manufacturing sector is red hot, driven by a pent-up demand rebound in goods consumption.
— Eric Basmajian (@EPBResearch) January 4, 2021
Commodity prices are screaming which gives legs to "goods" inflation in the short-term.
8) pic.twitter.com/rQcqHf1OD0
The full thread can be reviewed here:
Consensus continues to conflate the inflation story, mixing and matching long-term and short-term charts to fit what is generally a secular inflation narrative.
— Eric Basmajian (@EPBResearch) January 4, 2021
Here are my two cents to make the distinction clear.
1)
Today's PPI report should have been expected to surprise to the upside as the leading indicators of inflation have been screaming to the upside for months!
Here is the ISM prices paid index, cumulated into a growth rate
3/
Industrial commodity prices have also seen a major acceleration for months.
4/
So today's PPI report was in line with the leads, suggesting that we have a cyclical upturn in inflation that is * primarily concentrated in the manufacturing sector *
This is a key point.
5/

Buffett's letters taught me more about investing than any business school ever could.
Even after investing for 14 years, I uncover new insights every time I reread his letters.
Recently, I reread his letters from 1977 to 2020 for a third time.
Here are my key insights:

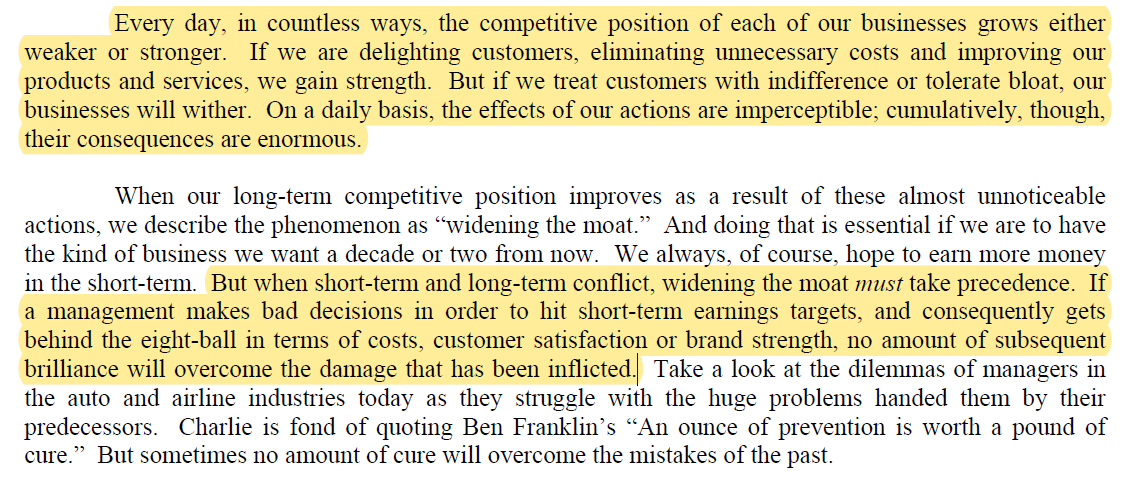
1. Moat is NEVER stagnant
A company's competitive position either grows stronger or weaker each day.
Widening the moat must always take precedence over short-term targets.
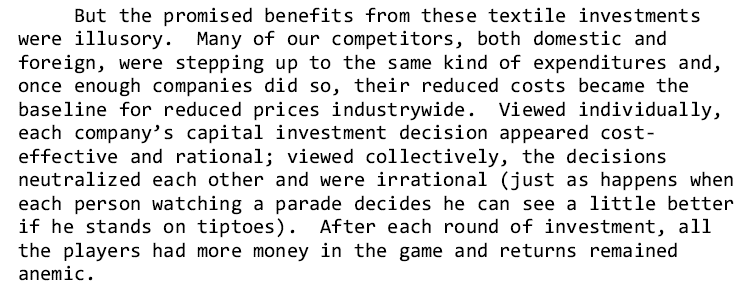
2. Commodity businesses
A business without moat will have its returns competed away.
Regardless of improvement, your competitors will quickly copy your advantage away.
Where returns on capital is dismal, reinvestment will only destroy value.
3. The flywheel effect
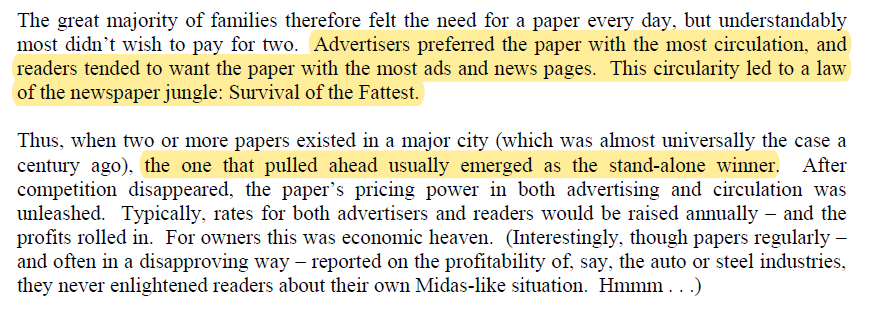
Buffett was preaching about the flywheel effect before it became cool.
Back then, newspapers were similar to today's platform businesses like Amazon, Meta, and App Store.
More readers beget more advertisers beget more readers.
4. Operating leverage
Companies with high fixed costs and low variable costs will see earnings rise faster than revenue.
However, it cuts both ways.
It becomes a disaster when revenue is declining.
Check out my article on how operating leverage works: https://t.co/Nv747oBAK0

Even after investing for 14 years, I uncover new insights every time I reread his letters.
Recently, I reread his letters from 1977 to 2020 for a third time.
Here are my key insights:
1. Moat is NEVER stagnant
A company's competitive position either grows stronger or weaker each day.
Widening the moat must always take precedence over short-term targets.
2. Commodity businesses
A business without moat will have its returns competed away.
Regardless of improvement, your competitors will quickly copy your advantage away.
Where returns on capital is dismal, reinvestment will only destroy value.
3. The flywheel effect
Buffett was preaching about the flywheel effect before it became cool.
Back then, newspapers were similar to today's platform businesses like Amazon, Meta, and App Store.
More readers beget more advertisers beget more readers.
4. Operating leverage
Companies with high fixed costs and low variable costs will see earnings rise faster than revenue.
However, it cuts both ways.
It becomes a disaster when revenue is declining.
Check out my article on how operating leverage works: https://t.co/Nv747oBAK0
You May Also Like








@franciscodeasis https://t.co/OuQaBRFPu7
Unfortunately the "This work includes the identification of viral sequences in bat samples, and has resulted in the isolation of three bat SARS-related coronaviruses that are now used as reagents to test therapeutics and vaccines." were BEFORE the

chimeric infectious clone grants were there.https://t.co/DAArwFkz6v is in 2017, Rs4231.
https://t.co/UgXygDjYbW is in 2016, RsSHC014 and RsWIV16.
https://t.co/krO69CsJ94 is in 2013, RsWIV1. notice that this is before the beginning of the project
starting in 2016. Also remember that they told about only 3 isolates/live viruses. RsSHC014 is a live infectious clone that is just as alive as those other "Isolates".
P.D. somehow is able to use funds that he have yet recieved yet, and send results and sequences from late 2019 back in time into 2015,2013 and 2016!
https://t.co/4wC7k1Lh54 Ref 3: Why ALL your pangolin samples were PCR negative? to avoid deep sequencing and accidentally reveal Paguma Larvata and Oryctolagus Cuniculus?
Unfortunately the "This work includes the identification of viral sequences in bat samples, and has resulted in the isolation of three bat SARS-related coronaviruses that are now used as reagents to test therapeutics and vaccines." were BEFORE the
chimeric infectious clone grants were there.https://t.co/DAArwFkz6v is in 2017, Rs4231.
https://t.co/UgXygDjYbW is in 2016, RsSHC014 and RsWIV16.
https://t.co/krO69CsJ94 is in 2013, RsWIV1. notice that this is before the beginning of the project
starting in 2016. Also remember that they told about only 3 isolates/live viruses. RsSHC014 is a live infectious clone that is just as alive as those other "Isolates".
P.D. somehow is able to use funds that he have yet recieved yet, and send results and sequences from late 2019 back in time into 2015,2013 and 2016!
https://t.co/4wC7k1Lh54 Ref 3: Why ALL your pangolin samples were PCR negative? to avoid deep sequencing and accidentally reveal Paguma Larvata and Oryctolagus Cuniculus?