A short thread on #MFI

The basics here :

Technical analysis says two things :
1. Momentum precedes price
2. Volumes precedes price

So, if an indicator includes momentum and volume analysis, it will be a leading indicator to some extent. This is the crux why I am so much confident on MFI
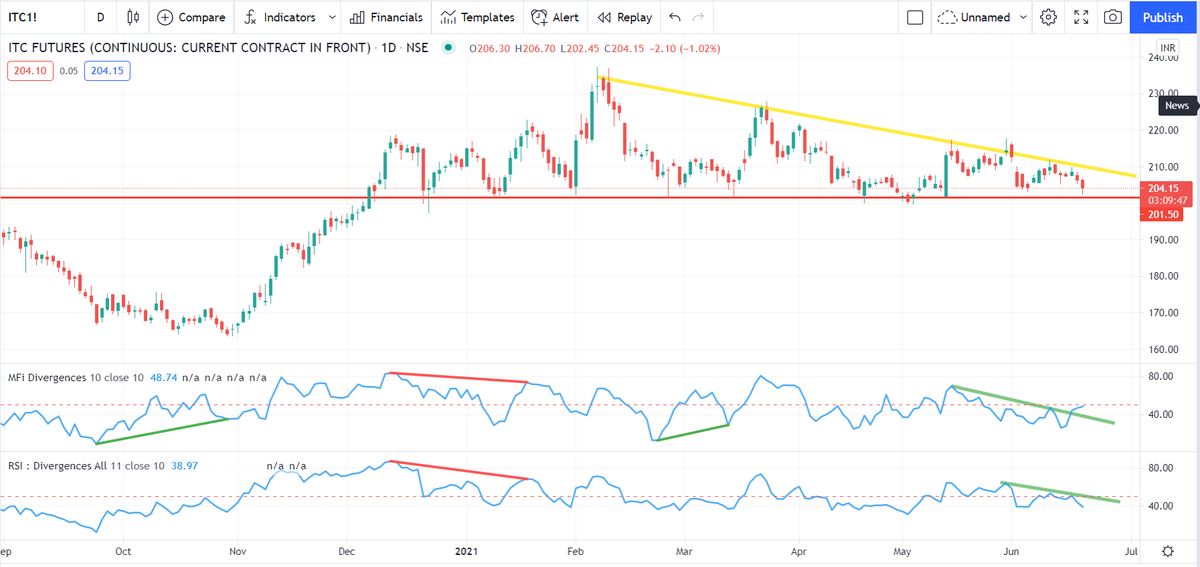
The indicator can be used for swing as well as day-trading. I use a period of 10 as I have seen that being our responsive to our markets here
Trendlines drawn on MFI or patterns might not be visible on price, normal trendline trading rules apply.

Divergences work and so does patterns

One can use MFI as a stand alone tool or as a supporting tool with other indicators
My indicator on divergences used codes was not allowed by tradingview ( future looking in a protected code). Tradingview has a good built-in divergence indicator which I have simply modified by plugging in MFI in place of RSI.
Since the original code here is not mine, publishing it as open source

https://t.co/uPQHQMr11o
Clicking inside the settings shows the hidden divergences also. Normally shows the standard divergences
Consider this a guru-purnima return gift. Play along with the code, study the indicator well and make it a part of your arsenal 🙏
If this also gets taken down, here is the code. Save it as your own indicator and use in future :

https://t.co/YflapyCfOe
Inside the code, substitute the MFI with any other indicator like RSI or MACD etc, the divergences will be plotted for them too

More from Subhadip Nandy

This friend had trouble making money in options though he was directionally right. Let us see how a basic understanding of greeks would have helped him, This thread will be about two attributes of option pricing, extrinsic value and theta


An option has two parts, intrinsic and extrinsic value. Think of a pack of Lay's potato chips. When you buy and open the pack, what you find is some chips and a lot of air. Intrinsic value is the chips, extrinsic value is air


https://t.co/8ZPv4ZnCiL


https://t.co/icWmqSLENW


https://t.co/vHA6azEmbQ
The most important question now on the mind of all analysts and traders. Is this a bear market rally or is this the start of a bull move. Retweeting this as I will need a few tweets to explain my view


Everyone knows the HH-HL or LH-LL as per Dow theory. This can be a bit confusing on how one marks the Highs and Lows. Long back, I picked up this trick from one of the neo-Dow theorists on what to do in scenarios like this

Simply plot a 5 period exponential moving average on a different panel. A 5-EMA simply shows you a running weekly perspective and kind of smoothens the price where a single spike high/low is not of that much importance

You will see this 5-ema also making HH.HL.LH.LL. So now, rather than focusing on the highs/lows on the charts, focusing on highs/lows on the 5-ema gives a cleaner perspective

As per this charts, unless the 5-ema now closes above 17540 ( the ema, not Nifty price) I will not play this as a bull market. I will deal with this market as a counter move against the major bear trend
Ok here is the explanation. Grab a cup of coffee and read on. If you have not read/noticed this, you will see intraday options movement in a new light.


Say we have two options, one 50 delta ATM options and another 30 delta OTM option. Normally for a 100 point move, the ATM option will move 50 points and the OTM option will move 30 points. But in a high volatile environment, the OTM option will also move nearly 50 points

To understand why this happens, first understand why an ATM option is 50 delta. An ATM option has the probability of 50% of expiring as ITM. The price just has to close a rupee above the strike for the CE to be ITM and vice versa for PEs

Now think of a highly volatile day like today. If someone is asked where the BNF will close for the day or expiry, no one can answer. BNF can close freakin anywhere, That makes every option of an equal probability of being ITM. So all options have a 50% probability of being ITM

Hence, when a huge volatile move starts, all OTM options behave like ATM options. This phenomenon was first observed in the Black Monday crash of 1987 at Wall Street, which also gave rise to the volatility skew/smirk

You May Also Like

ARE WE FAMILIAR WITH THE MEANING & POWER OF MANTRAS WE CHANT?

Whenever we chant a Mantra in Sanskrit, it starts with 'Om' and mostly ends with 'Swaha' or 'Namaha'. This specific alignment of words has a specific meaning to it which is explained in Dharma Shastra.


Mantra is a Sanskrit word meaning sacred syllable or sacred word. But Mantras r not just words put together,they r also vibrations.The whole Universe is a cosmic energy in different states of vibration &this energy in different states of vibration forms the objects of Universe.

According to Scriptures,Om is considered to be ekaakshar Brahman,which means Om is the ruler of 3 properties of creator,preserver&destroyer which make the
https://t.co/lyhkWeCdtv is also seen as a symbol of Lord Ganesha, as when starting the prayer,it's him who is worshipped 1st.


'Om' is the sound of the Universe. It's the first original vibration of the nothingness through which manifested the whole Cosmos. It represents the birth, death and rebirth process. Chanting 'Om' brings us into harmonic resonance with the Universe. It is a scientific fact.

Therefore, Mantras are described as vibrational words that are recited, spoken or sung and are invoked towards attaining some very specific results. They make very specific sounds at a frequency that conveys a directive into our subconcious.