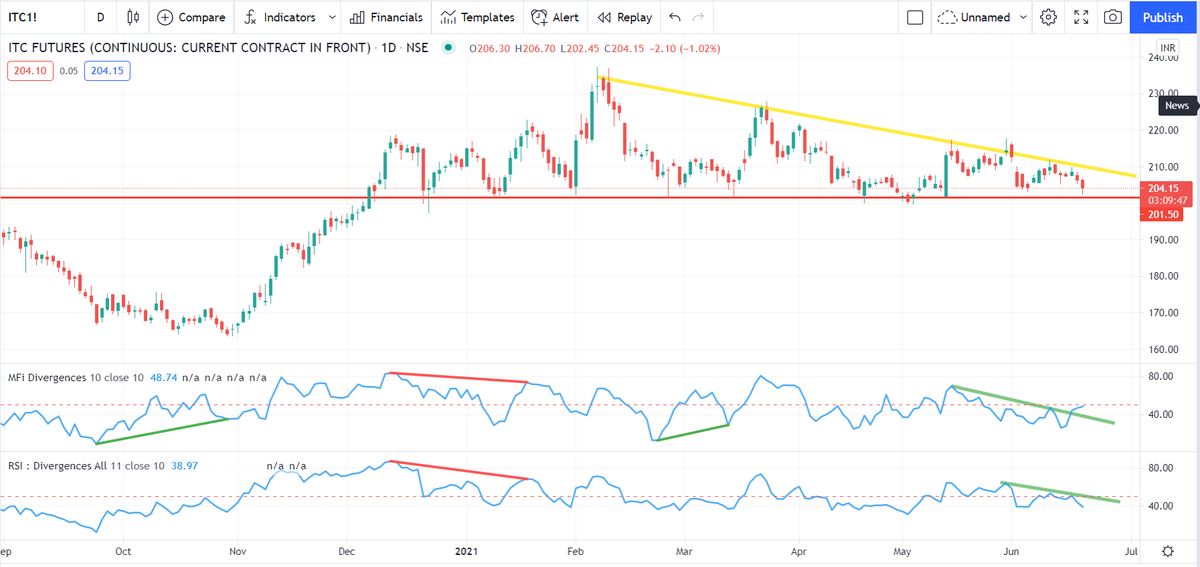
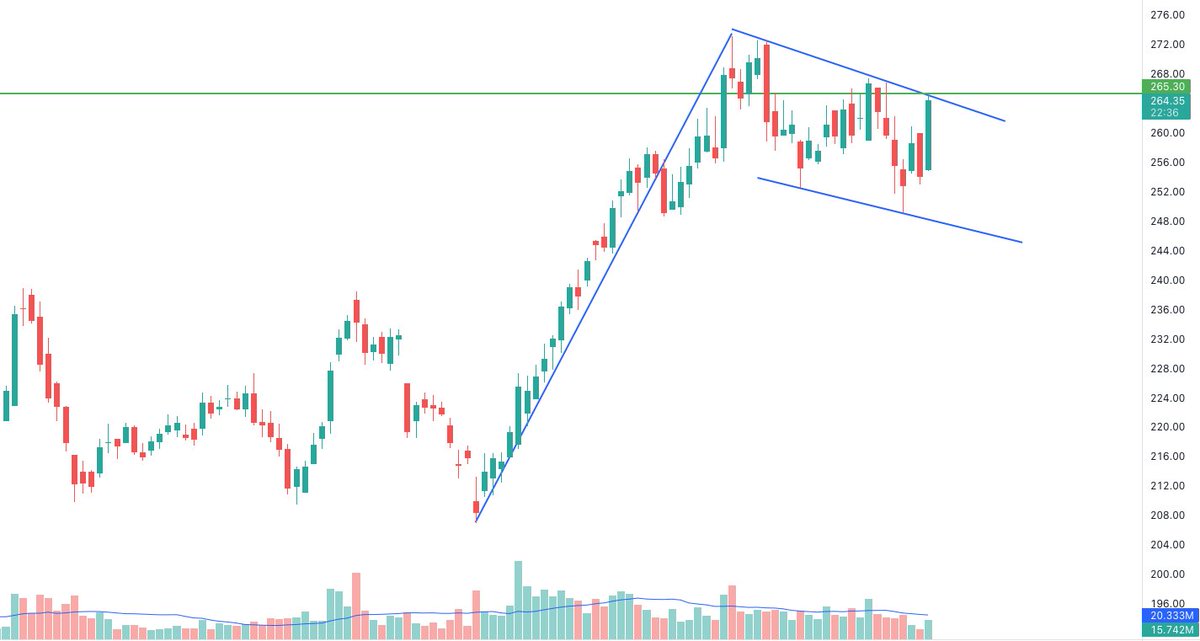
Since lot of discussions on ITC, had a simple look at the chart. With each passing day, the probability of a large breakout increases. Watch the behaviour of MFI, but wait for prices to trade above the trendline with volumes
More from Subhadip Nandy
In a high IV environment or when the market is very volatile
— Subhadip Nandy (@SubhadipNandy16) January 21, 2022
" OTM options will behave like ATM options", one will get almost the same delta movement
Say we have two options, one 50 delta ATM options and another 30 delta OTM option. Normally for a 100 point move, the ATM option will move 50 points and the OTM option will move 30 points. But in a high volatile environment, the OTM option will also move nearly 50 points
To understand why this happens, first understand why an ATM option is 50 delta. An ATM option has the probability of 50% of expiring as ITM. The price just has to close a rupee above the strike for the CE to be ITM and vice versa for PEs
Now think of a highly volatile day like today. If someone is asked where the BNF will close for the day or expiry, no one can answer. BNF can close freakin anywhere, That makes every option of an equal probability of being ITM. So all options have a 50% probability of being ITM
Hence, when a huge volatile move starts, all OTM options behave like ATM options. This phenomenon was first observed in the Black Monday crash of 1987 at Wall Street, which also gave rise to the volatility skew/smirk
What do you think/use as the most robust leading indicator if following technical analysis ? Please answer with reason , I will provide my answer after 2 hours
— Subhadip Nandy (@SubhadipNandy16) August 12, 2019
( At Delhi airport , bored as hell )
This thread actually had some great answers , one can learn a lot about the thought processes of different traders from the answers. Please go thru them


Is Nifty bullish, or bearish?
— AP (@ap_pune) March 19, 2022
Replies MUST be ONLY with charts, not just 'views', no Russia Ukraine, crude, gold etc.
Can be levels....abv/below
Just technicals....maybe with trend lines, indicators or any other study (EW, harmonics etc)
Charts can be daily, weekly or monthly.
Everyone knows the HH-HL or LH-LL as per Dow theory. This can be a bit confusing on how one marks the Highs and Lows. Long back, I picked up this trick from one of the neo-Dow theorists on what to do in scenarios like this
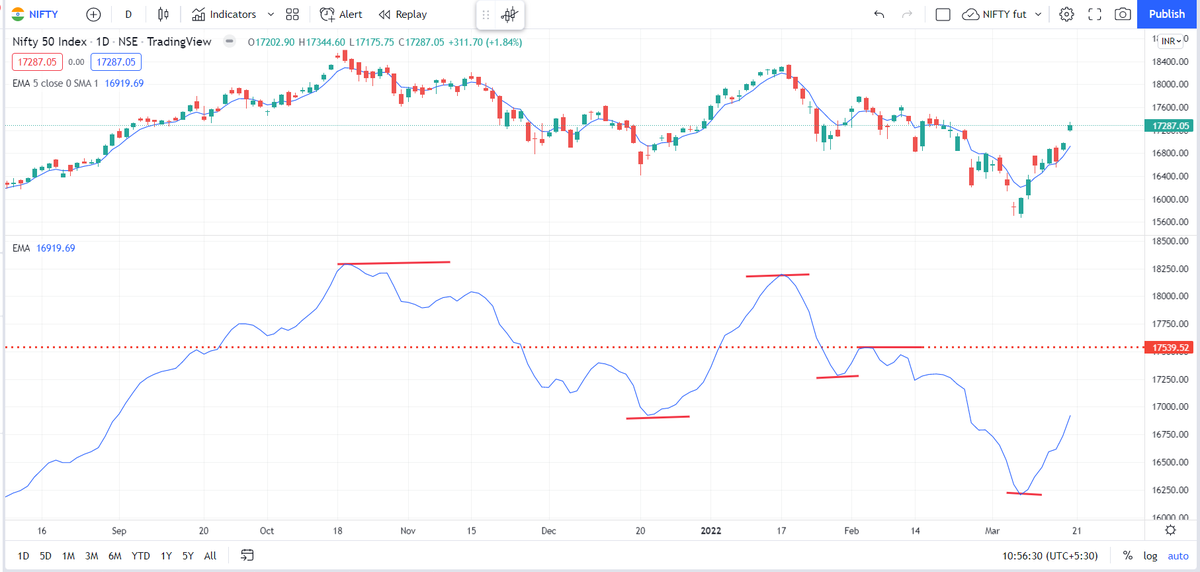
Simply plot a 5 period exponential moving average on a different panel. A 5-EMA simply shows you a running weekly perspective and kind of smoothens the price where a single spike high/low is not of that much importance
You will see this 5-ema also making HH.HL.LH.LL. So now, rather than focusing on the highs/lows on the charts, focusing on highs/lows on the 5-ema gives a cleaner perspective
As per this charts, unless the 5-ema now closes above 17540 ( the ema, not Nifty price) I will not play this as a bull market. I will deal with this market as a counter move against the major bear trend
More from Itc


You May Also Like

One thing I've been noticing about responses to today's column is that many people still don't get how strong the forces behind regional divergence are, and how hard to reverse 1/ https://t.co/Ft2aH1NcQt
— Paul Krugman (@paulkrugman) November 20, 2018
See this thing that @lymanstoneky wrote:
And see this thing that I wrote:
And see this book that @JamesFallows wrote:
And see this other thing that I wrote:


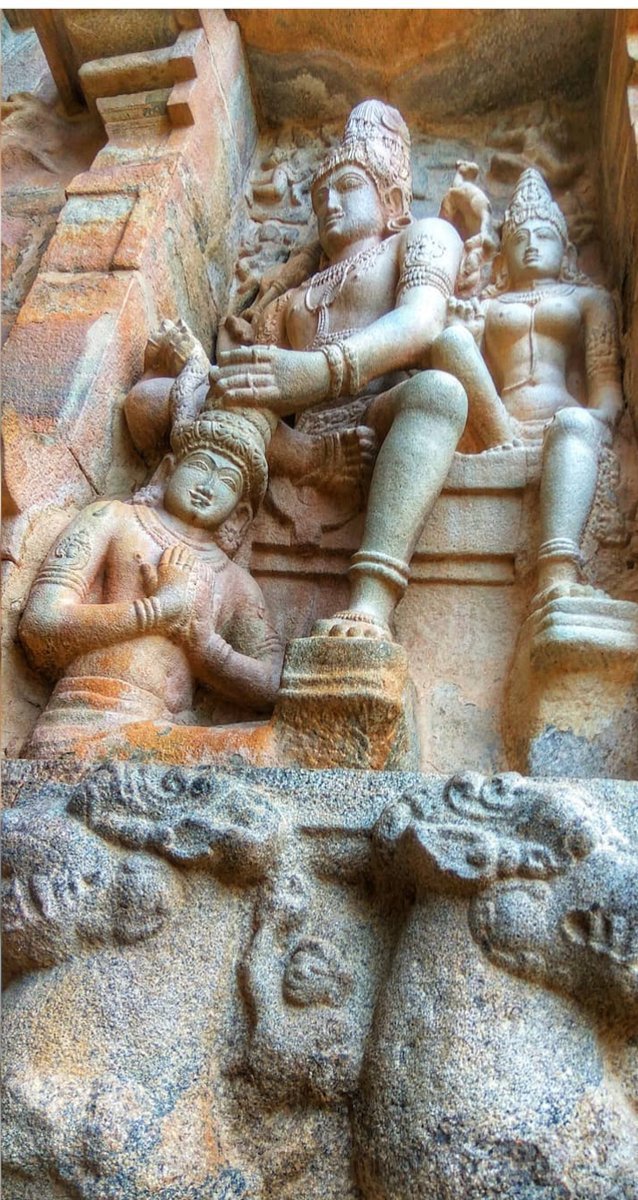
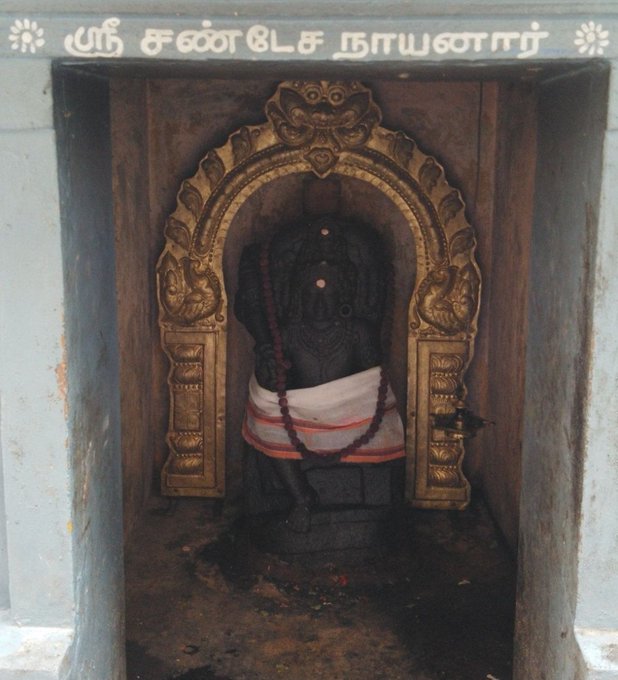
Chandesha-Anugraha Murti - One of the Sculpture in Brihadeshwara Temple at Gangaikonda Cholapuram - built by Raja Rajendra Chola I
This Sculpture depicts Bhagwan Shiva along with Devi Paravathi blessing Chandeshwara - one of the 63 Nayanmars.
#Thread
Chandeshwara/Chandikeshwara is regarded as custodian of Shiva Temple's wealth&most of Shiva temples in South India has separate sannathi for him.
His bhakti for Bhagwan Shiva elevated him as one of foremost among Nayanmars.
He gave importance to Shiva Pooja&protection of cows.
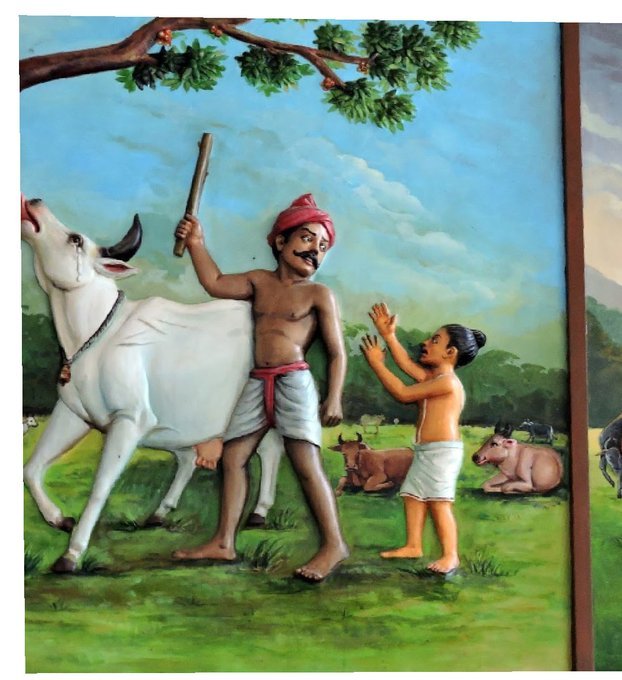
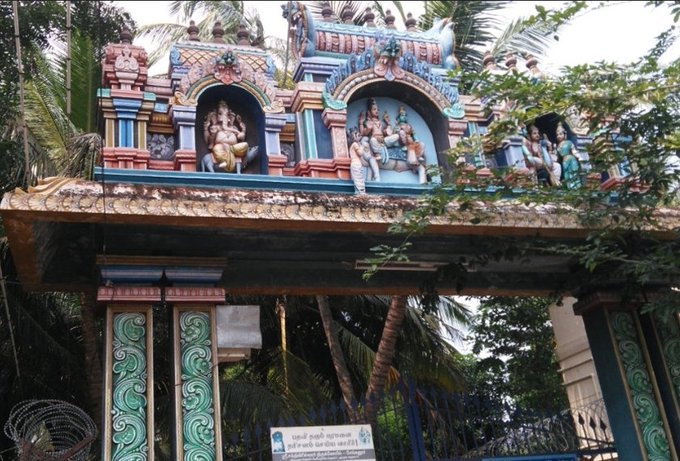
There are series of paintings, illustrating the #story of Chandikeshwar in the premises of
Sri Sathiyagireeswarar #Temple at Seinganur,near Kumbakonam,TN
Chandikeshwara's birth name
is Vichara sarman.He was born in the village of Senganur on the banks of River Manni.
His Parent names were Yajnathatan and Pavithrai.
Vichara Sarman was a gifted child and he learnt Vedas and Agamas at a very young age.
He was very devout and would always think about Bhagwan Shiva.
One day he saw a cowherd man brutally assaulting a cow,Vichara Sarman could not tolerate this. He spoke to cowherd: ‘Do you not know that the cow is worshipful & divine? All gods & Devas reside in https://t.co/ElLcI5ppsK it is our duty to protect cows &we should not to harm them.