Categories Finance
7 days
30 days
All time
Recent
Popular


Ivor Cummins has been wrong (or lying) almost entirely throughout this pandemic and got paid handsomly for it.
He has been wrong (or lying) so often that it will be nearly impossible for me to track every grift, lie, deceit, manipulation he has pulled. I will use...

... other sources who have been trying to shine on light on this grifter (as I have tried to do, time and again:
Example #1: "Still not seeing Sweden signal versus Denmark really"... There it was (Images attached).
19 to 80 is an over 300% difference.
Tweet: https://t.co/36FnYnsRT9

Example #2 - "Yes, I'm comparing the Noridcs / No, you cannot compare the Nordics."
I wonder why...
Tweets: https://t.co/XLfoX4rpck / https://t.co/vjE1ctLU5x

Example #3 - "I'm only looking at what makes the data fit in my favour" a.k.a moving the goalposts.
Tweets: https://t.co/vcDpTu3qyj / https://t.co/CA3N6hC2Lq

He has been wrong (or lying) so often that it will be nearly impossible for me to track every grift, lie, deceit, manipulation he has pulled. I will use...
... other sources who have been trying to shine on light on this grifter (as I have tried to do, time and again:
Ivor Cummins BE (Chem) is a former R&D Manager at HP (sourcre: https://t.co/Wbf5scf7gn), turned Content Creator/Podcast Host/YouTube personality. (Call it what you will.)
— Steve (@braidedmanga) November 17, 2020
Example #1: "Still not seeing Sweden signal versus Denmark really"... There it was (Images attached).
19 to 80 is an over 300% difference.
Tweet: https://t.co/36FnYnsRT9
Example #2 - "Yes, I'm comparing the Noridcs / No, you cannot compare the Nordics."
I wonder why...
Tweets: https://t.co/XLfoX4rpck / https://t.co/vjE1ctLU5x
Example #3 - "I'm only looking at what makes the data fit in my favour" a.k.a moving the goalposts.
Tweets: https://t.co/vcDpTu3qyj / https://t.co/CA3N6hC2Lq


Thread: P&F Super Pattern
An effective price pattern defined using properties of P&F charts.
#Superpattern #Pointandfigure #Definedge
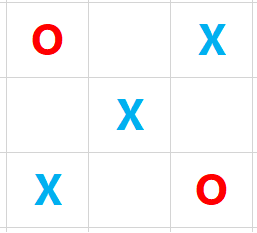
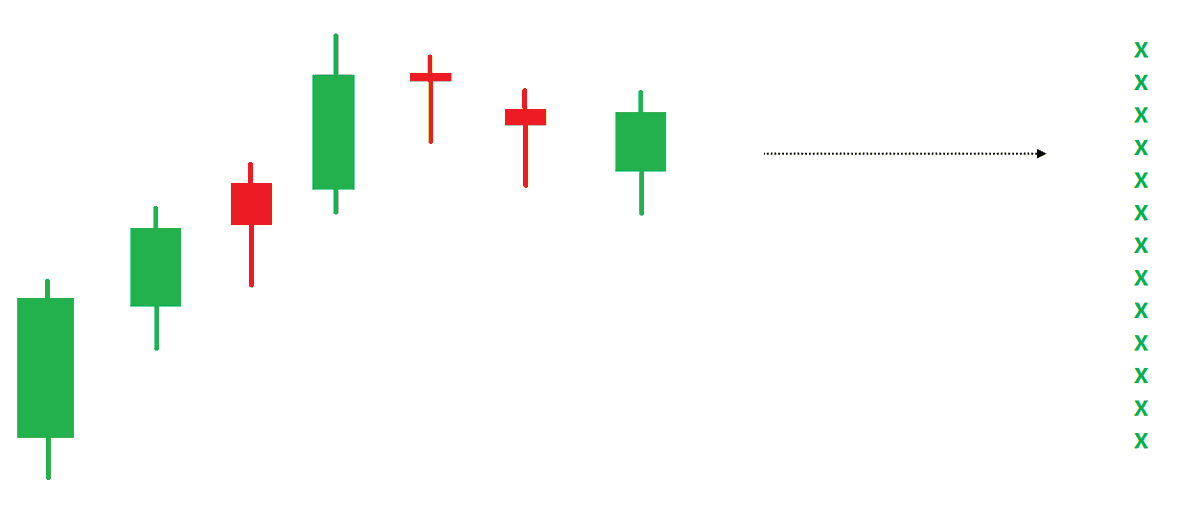
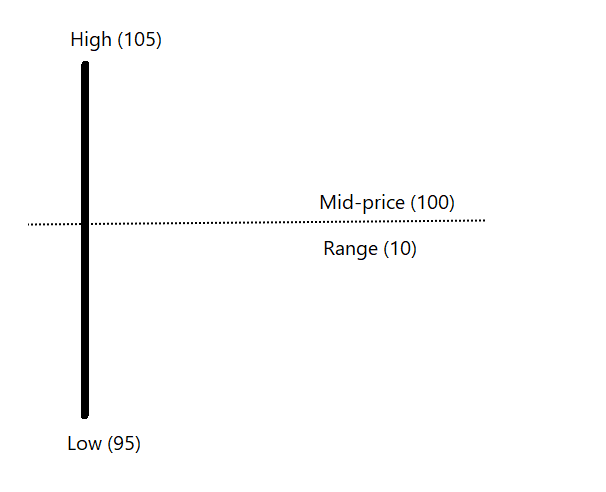
Point & Figure is an oldest charting method where price is plotted vertically, and the chart moves only when price moves. It is a different way of looking at the price, the objective box-value and reversal value offers advantage of identifying objective price patterns.
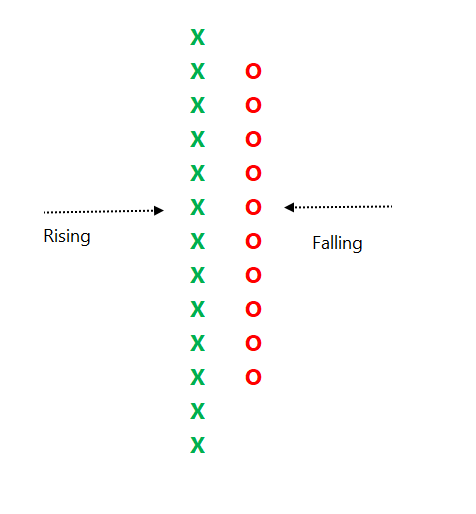
When price is moving up, it is plotted in a column of 'X'. When it is going down, it is plotted in a column of ‘O’. Normally, three-box reversal criteria is used to define the trend & reversal. Unlike a bar or candle, the P&F column can have multiple sessions in it.
Link to know more about the subject:
https://t.co/2xtLAVPBvm
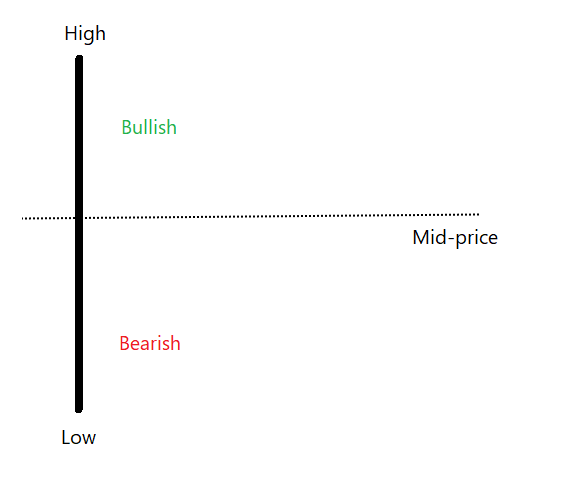
See below chart. Price is in a strong uptrend, P&F chart would produce a long of column of 'X' with more number of boxes in it.
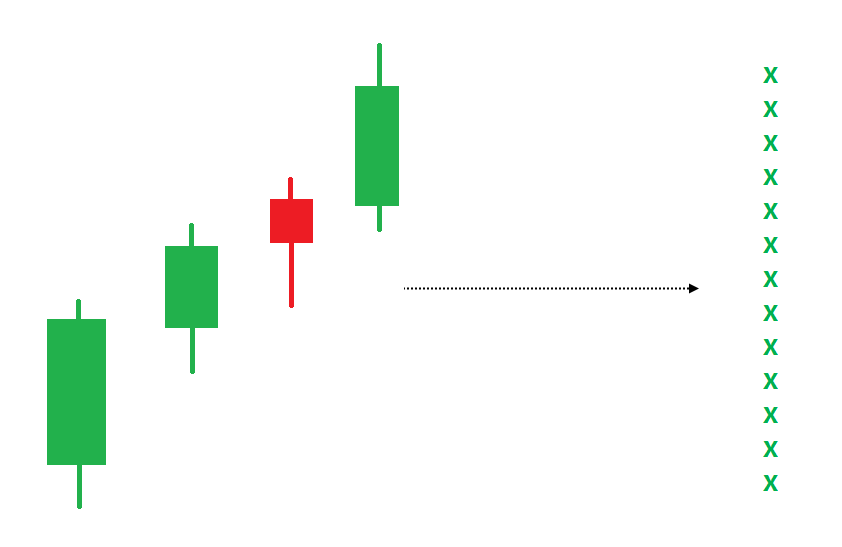
If such a trend is followed by some time bars without meaningful price correct, P&F chart would not move, and it will remain in column of 'X' in such a scenario.
An effective price pattern defined using properties of P&F charts.
#Superpattern #Pointandfigure #Definedge
Point & Figure is an oldest charting method where price is plotted vertically, and the chart moves only when price moves. It is a different way of looking at the price, the objective box-value and reversal value offers advantage of identifying objective price patterns.
When price is moving up, it is plotted in a column of 'X'. When it is going down, it is plotted in a column of ‘O’. Normally, three-box reversal criteria is used to define the trend & reversal. Unlike a bar or candle, the P&F column can have multiple sessions in it.
Link to know more about the subject:
https://t.co/2xtLAVPBvm
See below chart. Price is in a strong uptrend, P&F chart would produce a long of column of 'X' with more number of boxes in it.
If such a trend is followed by some time bars without meaningful price correct, P&F chart would not move, and it will remain in column of 'X' in such a scenario.


If you want to become financially independent and don't know where to start, here is a thread that will help you get started
/THREAD/
1. Review your expenses and make a budget
It will help you see where you overspend, make a plan to save, pay down debt and start
2. Set your investing and retirement goals
How much do you need to support yourself in retirement and when do you want to
3. The earlier you start investing, the better.
Here's why and how time and compounding can become your
4. Invest in an index fund
It's easy, safe, cheap, and the best choice for a beginner in investing, with not much time for
/THREAD/
1. Review your expenses and make a budget
It will help you see where you overspend, make a plan to save, pay down debt and start
Budgeting, the 50-30-20 rule, and the envelope method
— Kostas \U0001f468\u200d\U0001f4bc \U0001f4c8 \U0001f4b8 (@itsKostasWithK) January 6, 2021
Your first step towards financial independence
/THREAD/ pic.twitter.com/Tmuc3Itca5
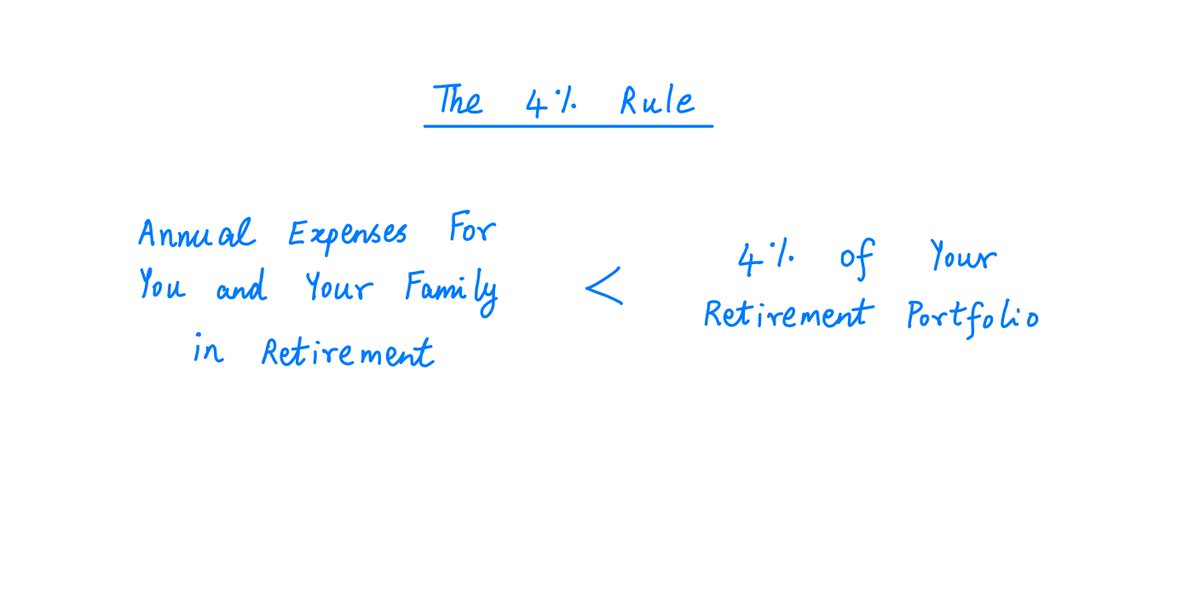
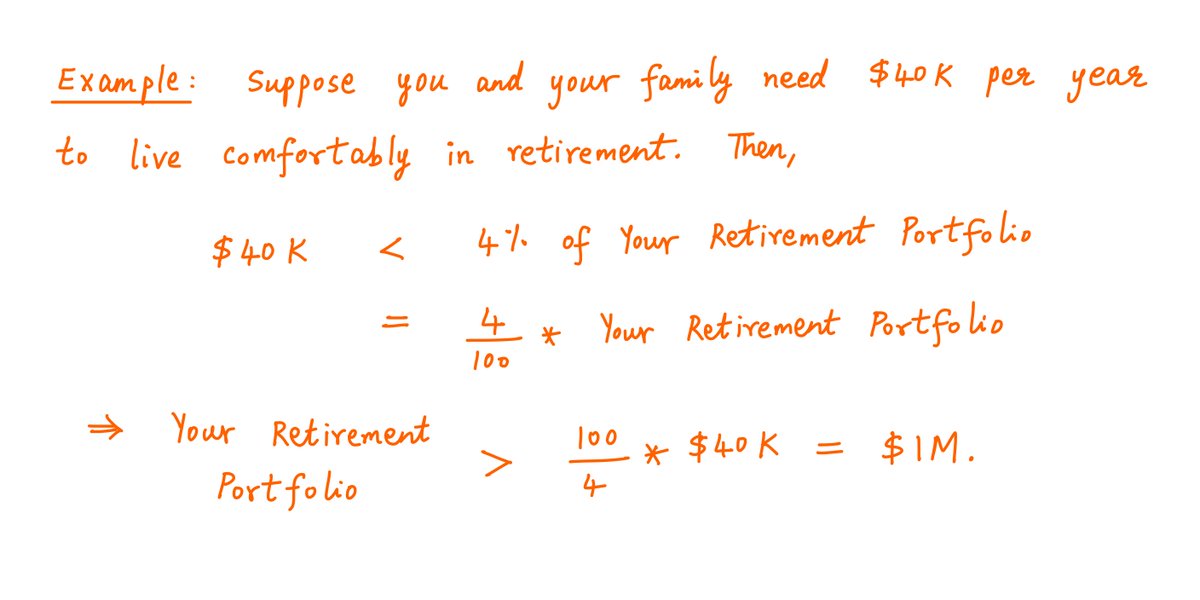
2. Set your investing and retirement goals
How much do you need to support yourself in retirement and when do you want to
The most important number for your retirement: The 4% rule
— Kostas \U0001f468\u200d\U0001f4bc \U0001f4c8 \U0001f4b8 (@itsKostasWithK) January 7, 2021
What Is the Four Percent Rule?
/THREAD/ pic.twitter.com/8n1R1UZI5c
3. The earlier you start investing, the better.
Here's why and how time and compounding can become your
The Miracle of Compound Interest and the Rule of 72
— Kostas \U0001f468\u200d\U0001f4bc \U0001f4c8 \U0001f4b8 (@itsKostasWithK) January 2, 2021
//THREAD// pic.twitter.com/AOqd3kL6cn
4. Invest in an index fund
It's easy, safe, cheap, and the best choice for a beginner in investing, with not much time for
Jack Bogle, the Father of Indexing
— Kostas \U0001f468\u200d\U0001f4bc \U0001f4c8 \U0001f4b8 (@itsKostasWithK) January 8, 2021
How John "Jack" Bogle's creation impacted investors more than Bill Gates, Steve Jobs, and Warren Buffett combined
/THREAD/ pic.twitter.com/4wPi8x3cXn


