They need repeat custom.
The payments wars in Japan are heating up and one of the battlegrounds is convenience store coffee.
“Coffee? What does that have to do with payments?” I’m glad you asked.
They need repeat custom.
The price point is $1 to about $2.
But the coffee is not very defensible
Enter payment apps.
And since booze and tobacco can’t meaningfully be used...
Family Mart has a closed loop store value app called Family Pay. It is a barcode based payment and does basically what you expect it to.
It is also a coupon platform, and will sell you an anywhere-in-chain “11 drinks for price of 10.”

App tracks progress. 6 more to go!
(I cropped the screen to avoid giving you a barcode that would let anyone snatch my coffee.)
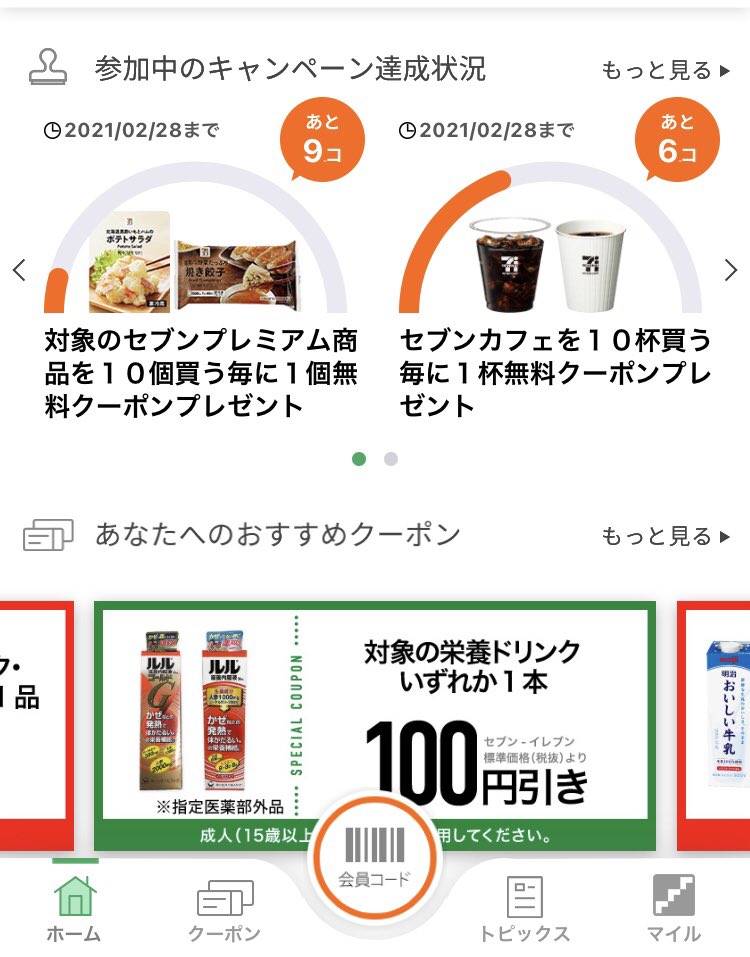
Automating all of this and having funds flow go Corp -> franchisee not F>C>F ameliorated problem.
More from Patrick McKenzie
There are a *lot* of software shops in the world that would far rather have one more technical dependency than they'd like to pay for one of their 20 engineers to become the company's SPOF expert on the joys of e.g. HTTP file uploads, CSV parsing bugs, PDF generation, etc.
Every year at MicroConf I get surprised-not-surprised by the number of people I meet who are running "Does one thing reasonably well, ranks well for it, pulls down a full-time dev salary" out of a fun side project which obviates a frequent 1~5 engineer-day sprint horizontally.
"Who is the prototypical client here?"
A consulting shop delivering a $X00k engagement for an internal system, a SaaS company doing something custom for a large client or internally facing or deeply non-core to their business, etc.
(I feel like many of these businesses are good answers to the "how would you monetize OSS to make it sustainable?" fashion, since they often wrap a core OSS offering in the assorted infrastructure which makes it easily consumable.)
"But don't the customers get subscription fatigue?"
I think subscription fatigue is far more reported by people who are embarrassed to charge money for software than it is experienced by for-profit businesses, who don't seem to have gotten pay-biweekly-for-services fatigue.
On a serious note, it's interesting to observe that you can build a decent business charging $20 - $50 per month for something that any good developer can set up. This is one of those micro-saas sweet spots between "easy for me to build" and "tedious for others to build"
— Jon Yongfook (@yongfook) September 5, 2019
Every year at MicroConf I get surprised-not-surprised by the number of people I meet who are running "Does one thing reasonably well, ranks well for it, pulls down a full-time dev salary" out of a fun side project which obviates a frequent 1~5 engineer-day sprint horizontally.
"Who is the prototypical client here?"
A consulting shop delivering a $X00k engagement for an internal system, a SaaS company doing something custom for a large client or internally facing or deeply non-core to their business, etc.
(I feel like many of these businesses are good answers to the "how would you monetize OSS to make it sustainable?" fashion, since they often wrap a core OSS offering in the assorted infrastructure which makes it easily consumable.)
"But don't the customers get subscription fatigue?"
I think subscription fatigue is far more reported by people who are embarrassed to charge money for software than it is experienced by for-profit businesses, who don't seem to have gotten pay-biweekly-for-services fatigue.
More from Finance









You May Also Like

First update to https://t.co/lDdqjtKTZL since the challenge ended – Medium links!! Go add your Medium profile now 👀📝 (thanks @diannamallen for the suggestion 😁)

Just added Telegram links to https://t.co/lDdqjtKTZL too! Now you can provide a nice easy way for people to message you :)

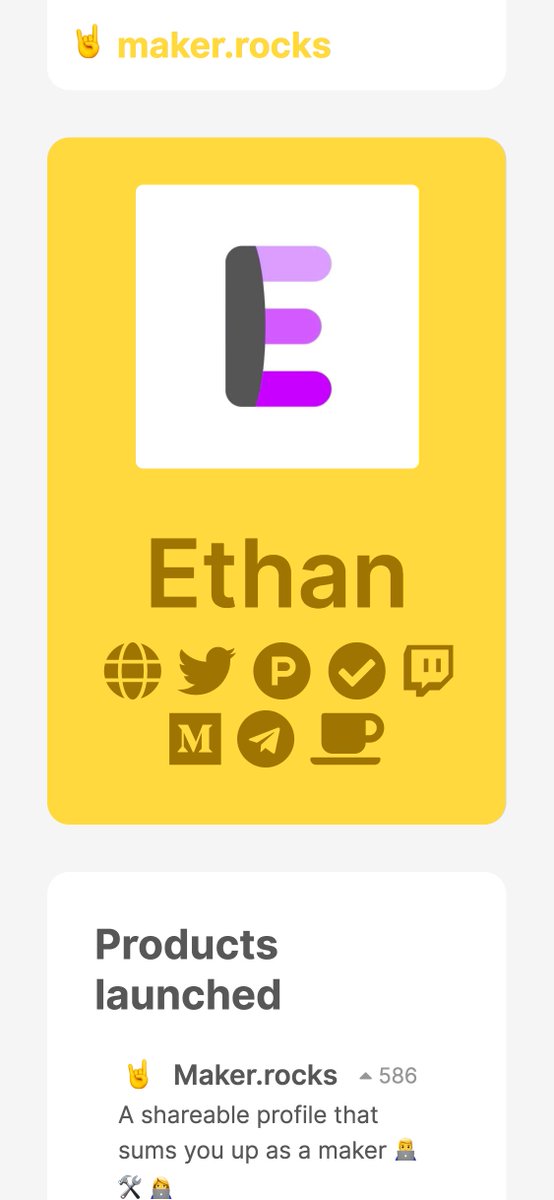
Less than 1 hour since I started adding stuff to https://t.co/lDdqjtKTZL again, and profile pages are now responsive!!! 🥳 Check it out -> https://t.co/fVkEL4fu0L
Accounts page is now also responsive!! 📱✨
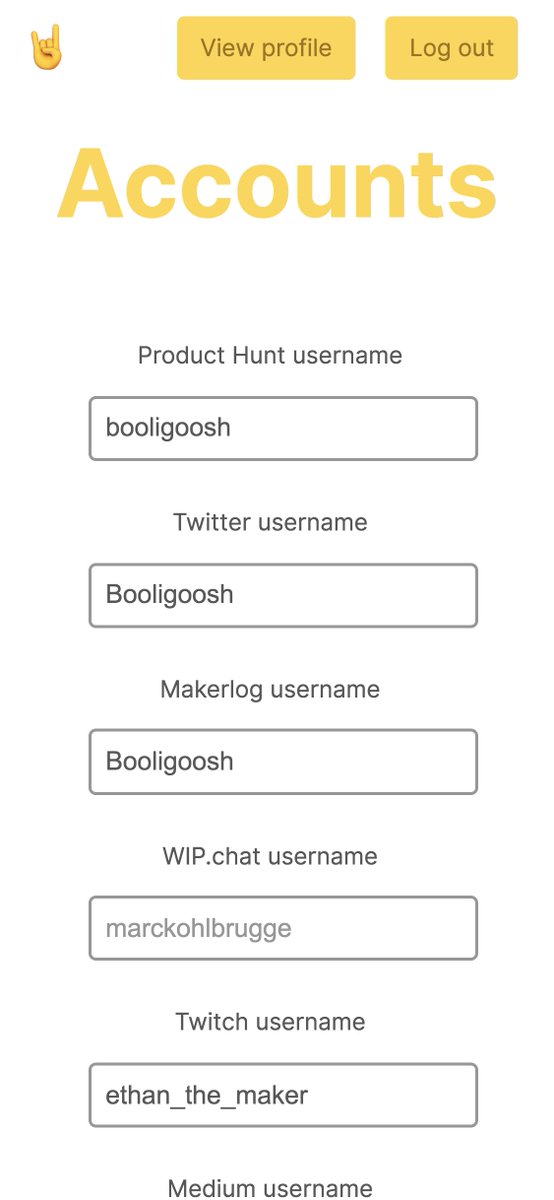
💪 I managed to make the whole site responsive in about an hour. On my roadmap I had it down as 4-5 hours!!! 🤘🤠🤘
Just added Telegram links to https://t.co/lDdqjtKTZL too! Now you can provide a nice easy way for people to message you :)
Less than 1 hour since I started adding stuff to https://t.co/lDdqjtKTZL again, and profile pages are now responsive!!! 🥳 Check it out -> https://t.co/fVkEL4fu0L
Accounts page is now also responsive!! 📱✨
💪 I managed to make the whole site responsive in about an hour. On my roadmap I had it down as 4-5 hours!!! 🤘🤠🤘