Thread: P&F Super Pattern
An effective price pattern defined using properties of P&F charts.
#Superpattern #Pointandfigure #Definedge
https://t.co/2xtLAVPBvm
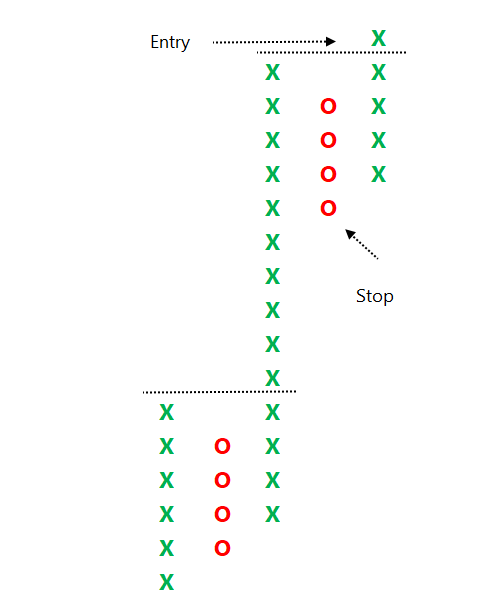
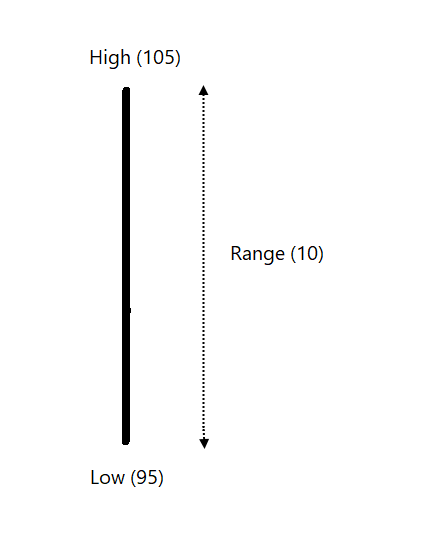
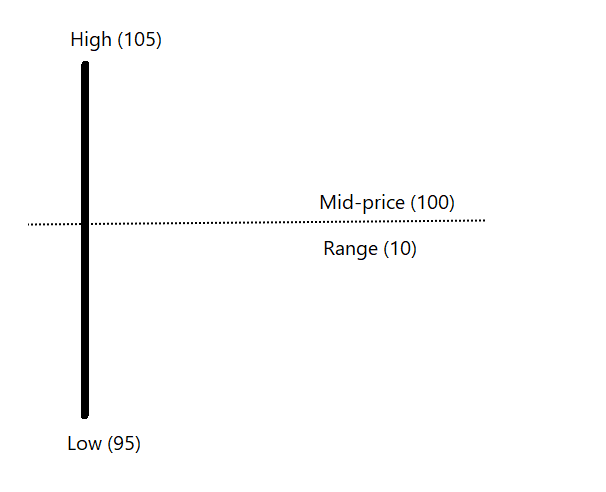
See below chart. Price is in a strong uptrend, P&F chart would produce a long of column of 'X' with more number of boxes in it.
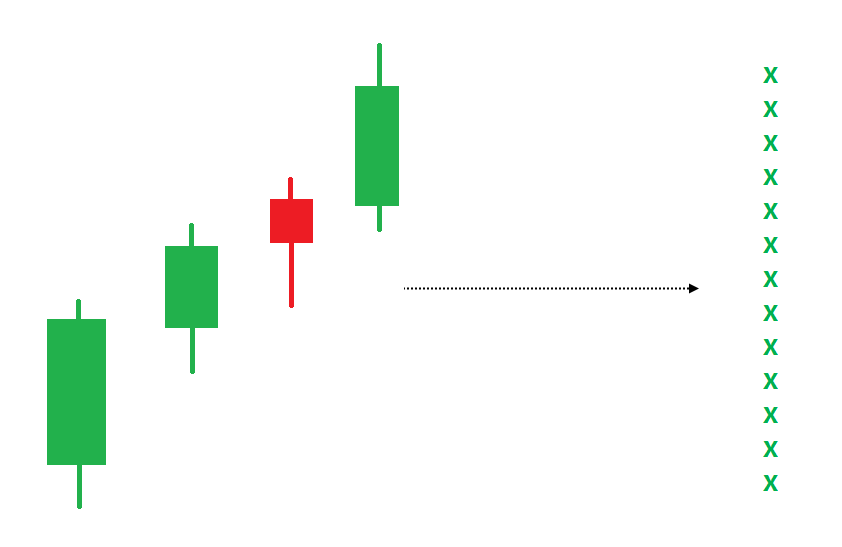
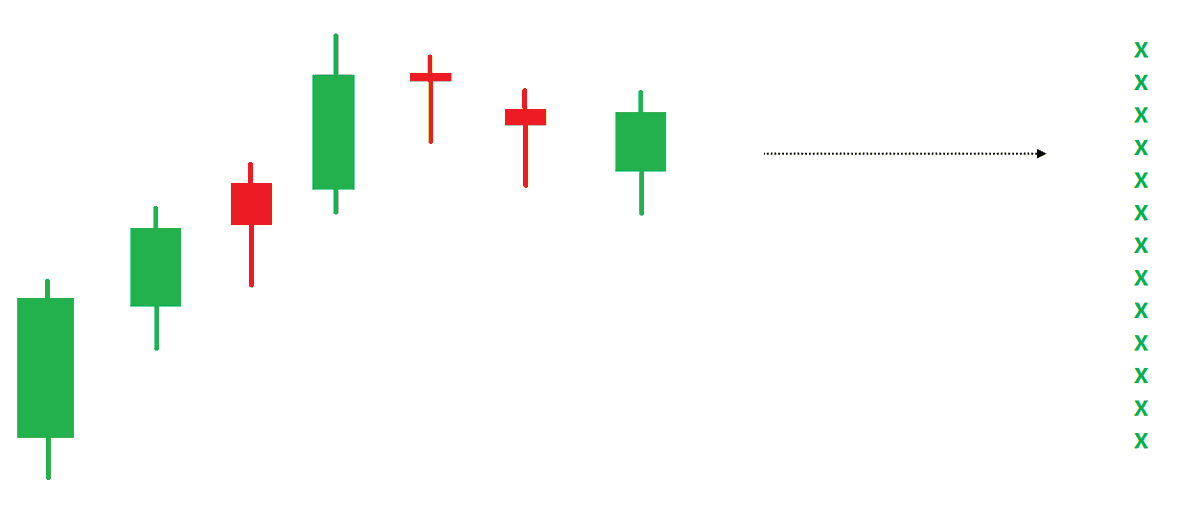
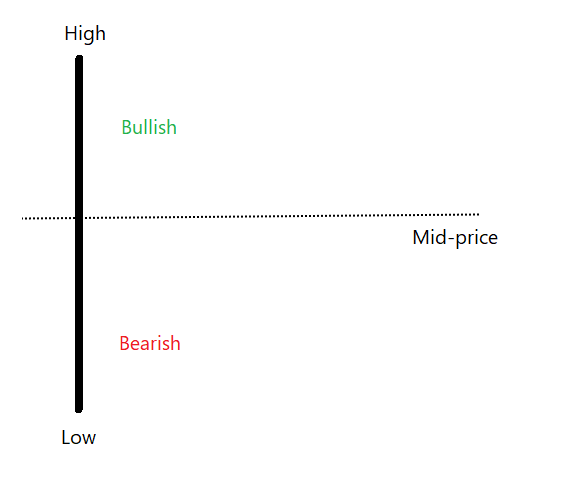
So, the pattern is: Breakout, strong trend, shallow retracement & follow-through price action.
How it is defined clearly and made objective on a P&F chart?
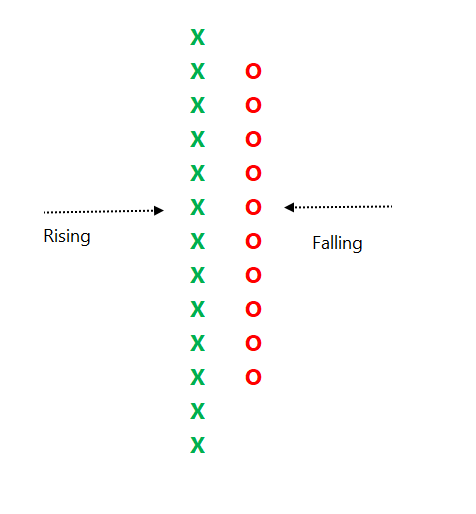
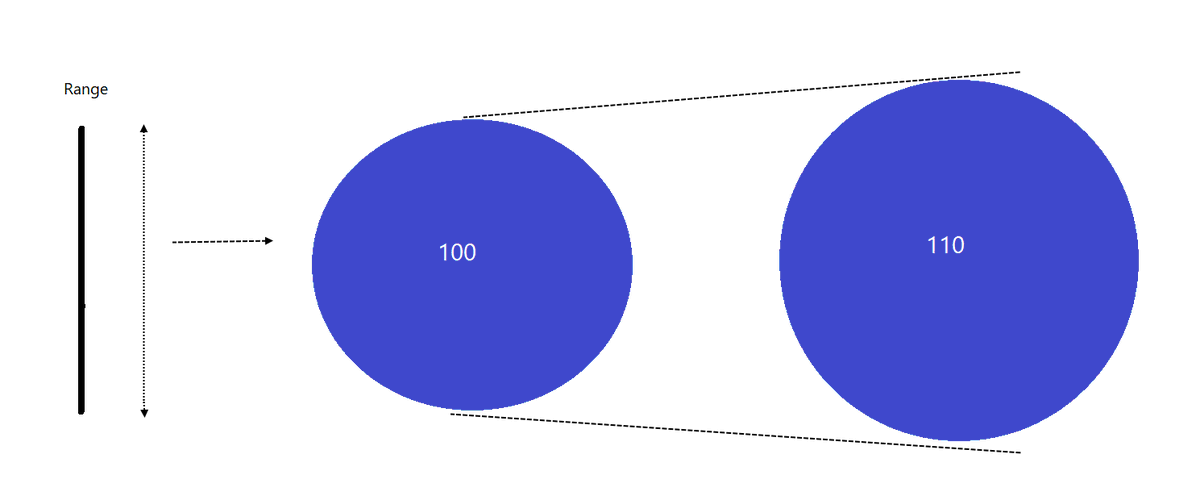
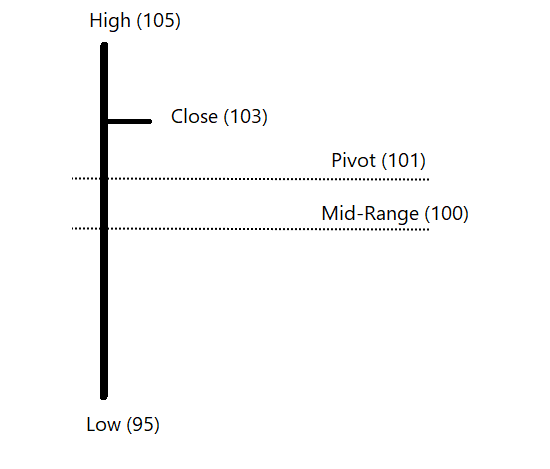
Strong trend= More than 10 boxes of 'X' after breakout
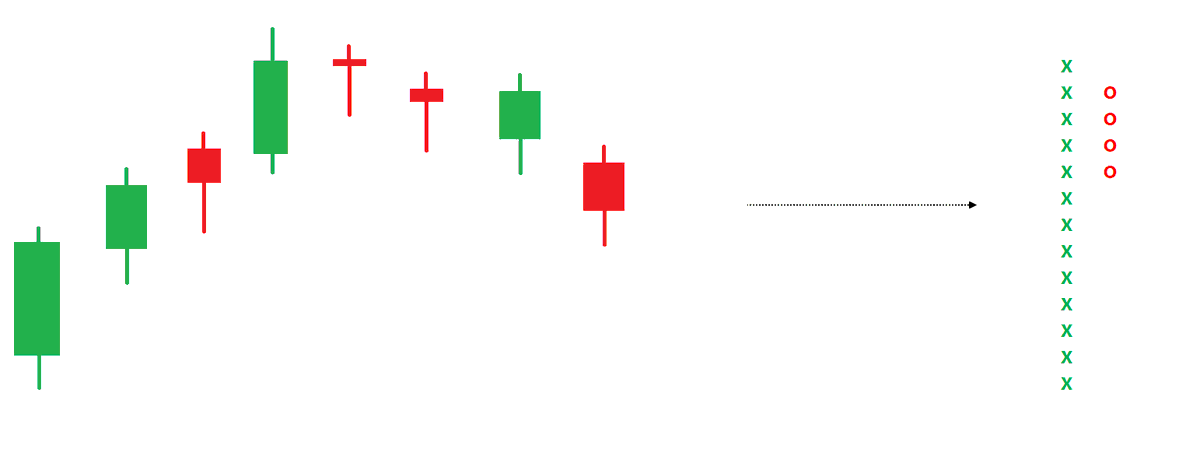
Shallow retracement = Not more than 4 boxes after strong trend
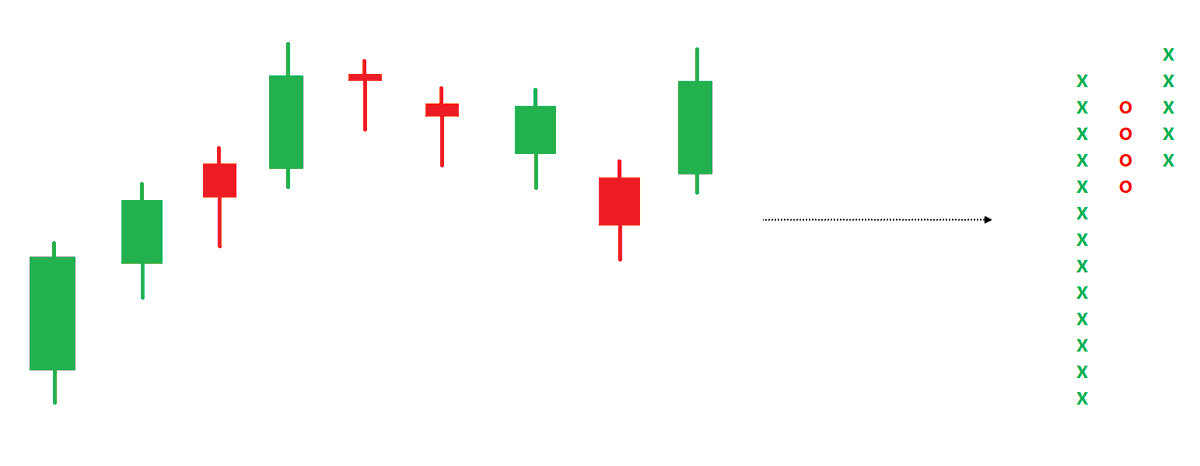
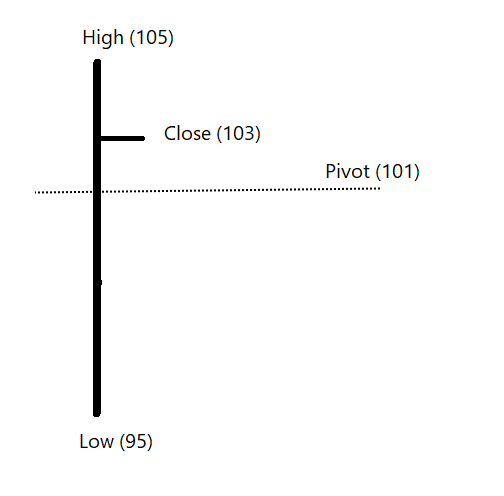
Follow-through = Double-top buy after correction
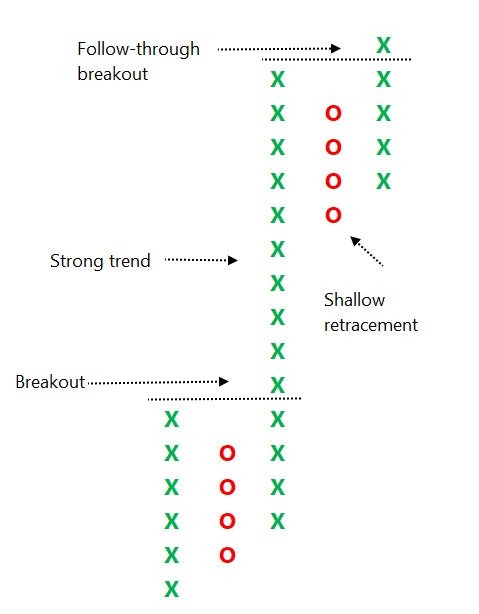
Initial stop-loss in affordable and risk-reward is high that makes it a tradeable pattern with positive expectancy.
More from Prashant Shah

More from Finance

I'm lucky to attain financial freedom before 30.
I credit Fintwit for my learnings.
Here's 10 key concepts every investor must know:
1. $$ needed to retire
2. Researching a business
3. Reading annual reports
4. Reading earnings calls
5. Criteria of a multi bagger
(Read on...)
6. Holding a multi bagger
7. Economic moats
8. When to buy a stock
9. Earnings vs cashflow
10. Traits of quality companies
Here's my 10 favourite threads on these concepts:
1. How much $$ do you need to retire
Before you start, you must know the end game.
To meet your retirement goals...
How much $$ do you need in your portfolio?
10-K Diver does a good job explaining what's a safe withdrawl rate.
Hint: It's NOT
2. Research a business
Your investment returns are a lagging indicator.
Instead, your research skills are the leading predictor of your results.
Conclusion?
To be a good investor, you must be a great business researcher.
Start with
3. Reading annual reports
This is the bread and butter of a good business analyst.
You cannot just listen to opinions from others.
You must learn to deep dive a business and make your own judgments.
Start with the 10k.
Ming Zhao explains it
I credit Fintwit for my learnings.
Here's 10 key concepts every investor must know:
1. $$ needed to retire
2. Researching a business
3. Reading annual reports
4. Reading earnings calls
5. Criteria of a multi bagger
(Read on...)
6. Holding a multi bagger
7. Economic moats
8. When to buy a stock
9. Earnings vs cashflow
10. Traits of quality companies
Here's my 10 favourite threads on these concepts:
1. How much $$ do you need to retire
Before you start, you must know the end game.
To meet your retirement goals...
How much $$ do you need in your portfolio?
10-K Diver does a good job explaining what's a safe withdrawl rate.
Hint: It's NOT
1/
— 10-K Diver (@10kdiver) July 25, 2020
Get a cup of coffee.
In this thread, I'll help you work out how much money you need to retire.
2. Research a business
Your investment returns are a lagging indicator.
Instead, your research skills are the leading predictor of your results.
Conclusion?
To be a good investor, you must be a great business researcher.
Start with
1/ Thoughts on Research Process
— Mostly Borrowed Ideas (@borrowed_ideas) September 27, 2021
I was invited to present my research process at a college in the US. I am sharing all ten slides here. pic.twitter.com/z0tjZcogfH
3. Reading annual reports
This is the bread and butter of a good business analyst.
You cannot just listen to opinions from others.
You must learn to deep dive a business and make your own judgments.
Start with the 10k.
Ming Zhao explains it
\U0001f9d0How to Read 10Ks Like a Hedge Fund\U0001f9d0
— Ming Zhao (@FabiusMercurius) May 7, 2021
\u201cFundamentals don\u2019t matter anymore!\u201d I\u2019ve heard this a lot lately on Fintwit.\U0001f644
But, for those who\u2019ve diversify beyond $GME and $DOGE, here\u2019s a primer on what metrics fundamental buy-side PMs look at and why:
(real examples outlined)
\U0001f447 pic.twitter.com/tLlNRvpnDK


If you want to become financially independent and don't know where to start, here is a thread that will help you get started
/THREAD/
1. Review your expenses and make a budget
It will help you see where you overspend, make a plan to save, pay down debt and start
2. Set your investing and retirement goals
How much do you need to support yourself in retirement and when do you want to
3. The earlier you start investing, the better.
Here's why and how time and compounding can become your
4. Invest in an index fund
It's easy, safe, cheap, and the best choice for a beginner in investing, with not much time for
/THREAD/
1. Review your expenses and make a budget
It will help you see where you overspend, make a plan to save, pay down debt and start
Budgeting, the 50-30-20 rule, and the envelope method
— Kostas \U0001f468\u200d\U0001f4bc \U0001f4c8 \U0001f4b8 (@itsKostasWithK) January 6, 2021
Your first step towards financial independence
/THREAD/ pic.twitter.com/Tmuc3Itca5
2. Set your investing and retirement goals
How much do you need to support yourself in retirement and when do you want to
The most important number for your retirement: The 4% rule
— Kostas \U0001f468\u200d\U0001f4bc \U0001f4c8 \U0001f4b8 (@itsKostasWithK) January 7, 2021
What Is the Four Percent Rule?
/THREAD/ pic.twitter.com/8n1R1UZI5c
3. The earlier you start investing, the better.
Here's why and how time and compounding can become your
The Miracle of Compound Interest and the Rule of 72
— Kostas \U0001f468\u200d\U0001f4bc \U0001f4c8 \U0001f4b8 (@itsKostasWithK) January 2, 2021
//THREAD// pic.twitter.com/AOqd3kL6cn
4. Invest in an index fund
It's easy, safe, cheap, and the best choice for a beginner in investing, with not much time for
Jack Bogle, the Father of Indexing
— Kostas \U0001f468\u200d\U0001f4bc \U0001f4c8 \U0001f4b8 (@itsKostasWithK) January 8, 2021
How John "Jack" Bogle's creation impacted investors more than Bill Gates, Steve Jobs, and Warren Buffett combined
/THREAD/ pic.twitter.com/4wPi8x3cXn


Two year back thread on MFI, someone liked this so came up in notifications . Rather than running around 100s of indicators, I have made this my go to indicator under any circumstances and have been using this for years
This thread actually had some great answers , one can learn a lot about the thought processes of different traders from the answers. Please go thru them
What do you think/use as the most robust leading indicator if following technical analysis ? Please answer with reason , I will provide my answer after 2 hours
— Subhadip Nandy (@SubhadipNandy16) August 12, 2019
( At Delhi airport , bored as hell )
This thread actually had some great answers , one can learn a lot about the thought processes of different traders from the answers. Please go thru them