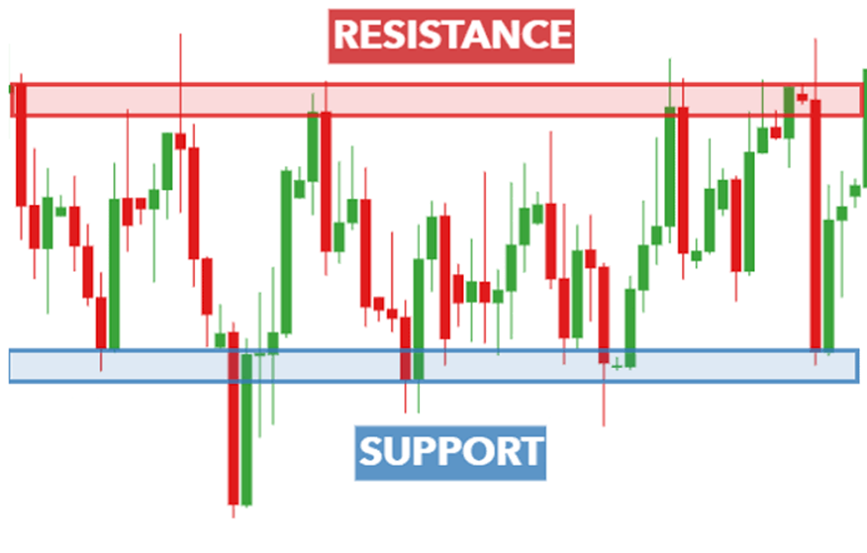
Categories Catagory trading
A Thread 🧵🧵
Tested - Executed in Real - Works
Kindly Re-Tweet for Max Reach 🙏🙏
1) Buy a Gainer when bounce from VWAP
Condition apply to chart ink -
- Stock days' gain > 1%
- Candle Low < VWAP and Close > VWAP
- Now check chart manually
You will get list of stocks that are gainers and consolidated to bounce from VWAP
https://t.co/W7HVmFvYpy

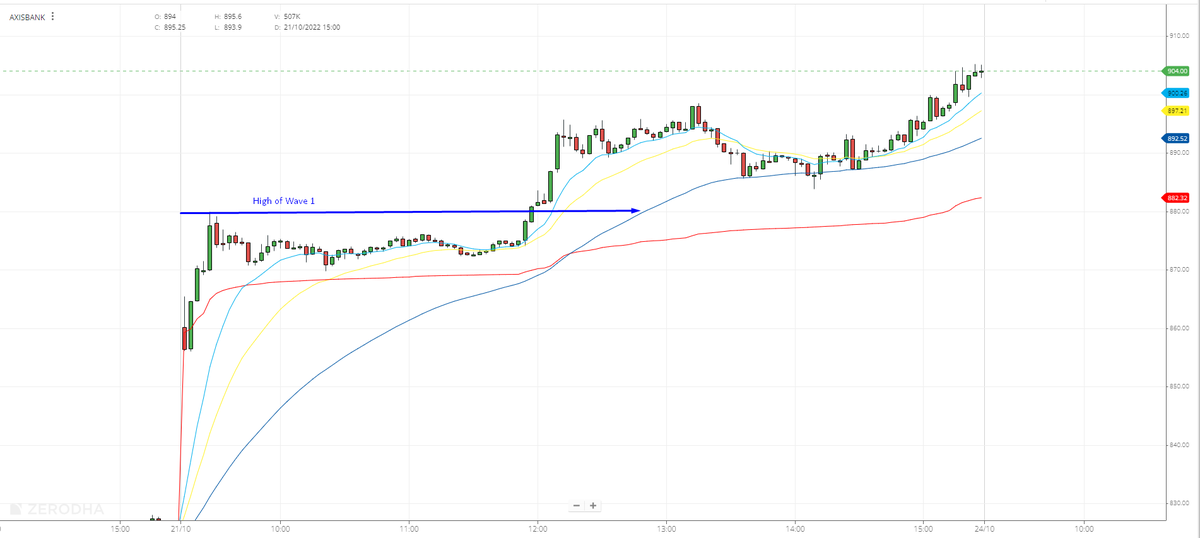
2) Near Day High
- Top gainers make 3-4 times new High in a day
- Best to enter when it break High of one wave
- Check charts manually after you get list
This screener gives you stocks that are near day High
Apply this with Time frame 3 or 15 min -
https://t.co/ocM7Whvtdi
3) Stocks at Resistance -
Conditions to apply -
- Stock day's gain > 1%
- High of Last 3-4 candles is equal
Apply like this -

4) Bullish Engulfing -
Very Good Signal for Intraday buying any time frame
Here is the screener -
Change Time frame according to
The thread contain all the FREE CONTENT which I have shared so far.
Everyone support us by RETWEET & LIKE so it can reach wider and benefit many traders.
YouTube channel - https://t.co/pUUwDN7IO5
Telegram channel - https://t.co/VU0bCGjU7s

Make sure scroll down till last tweet in this thread and learn from all the below content shared related Trading.
Join the Telegram channel for live market updates
Scroll down
Price Action Trading Strategy for Directional traders
Scroll down
Price Action Trading ( Without Indicators)
— Learn to Trade (@learntotrade365) August 20, 2022
Intraday Trading strategy for all Directional traders.
Intraday Trading Strategy Thread \U0001f9f5
Support us by RETWEET to reach and benefit maximum traders
Scroll down \U0001f447 pic.twitter.com/AVsKmWroMc
VWAP + PIVOT POINTS Intraday Trading Strategy for Directional traders
Scroll down
Vwap with Pivot Points
— Learn to Trade (@learntotrade365) August 14, 2022
Intraday Trading strategy for Trend followers ( Will share also for mean reversion trader as soon as possible )
Intraday Trading Strategy Thread \U0001f9f5
Support us by Retweet to reach and benefit maximum traders
Scroll down \U0001f447 pic.twitter.com/xYPPnqWQ02
Buyers vs Sellers - To identify index direction using candlesticks charts
Scroll down
Buyers vs Sellers
— Learn to Trade (@learntotrade365) August 13, 2022
A simple technique to understand the index direction using candlesticks chart.
Intraday Trading Thread \U0001f9f5
Retweet to reach & benefit maximum traders
Scroll down \U0001f447 pic.twitter.com/6vMK92EqDo
8 Years Experience in 8 Tweets
Worth any workshop of 10-15k
Re-Tweet Like to help others 🙏🙏
1) Psychology Mistakes - Don't change your stand after entering a trade
Everyone think against his own trade after entering a trade.
- Don't move SL accept it
- Don't exit before SL hit
You analysis is💩 once you are in a trade and that will improve with time.

2) Position Size Mistakes - Don't enter with big quantity at once
Intraday is a game of small SL and you might hit SL even if your analysis is correct.
Give chart some space to move and let it take your SL of 1000 quantity but if it moves in your fav then increase it to 2-3k
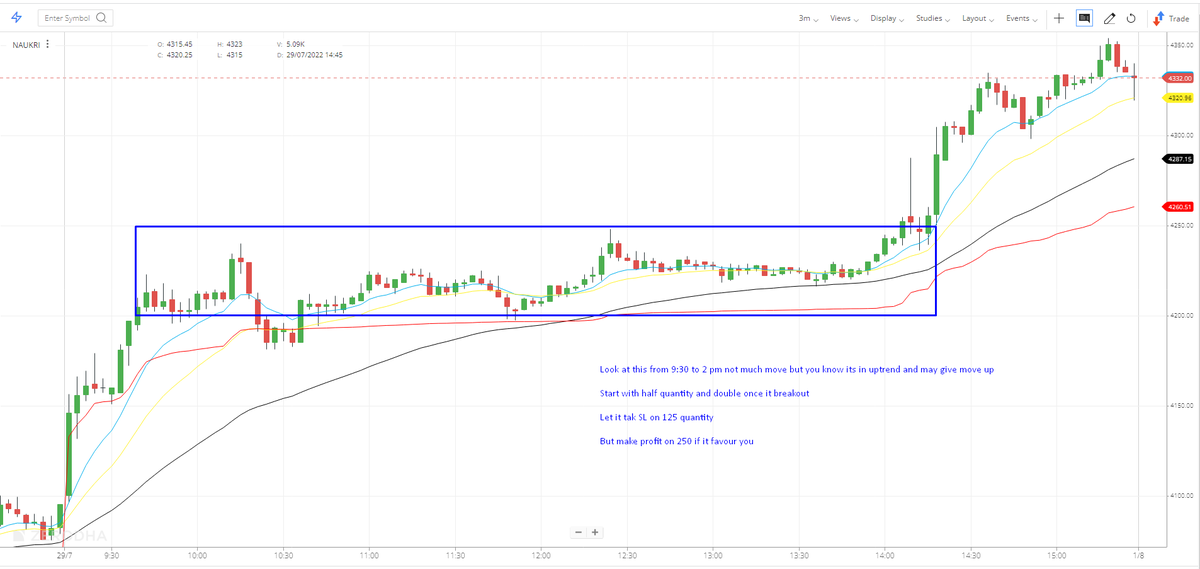
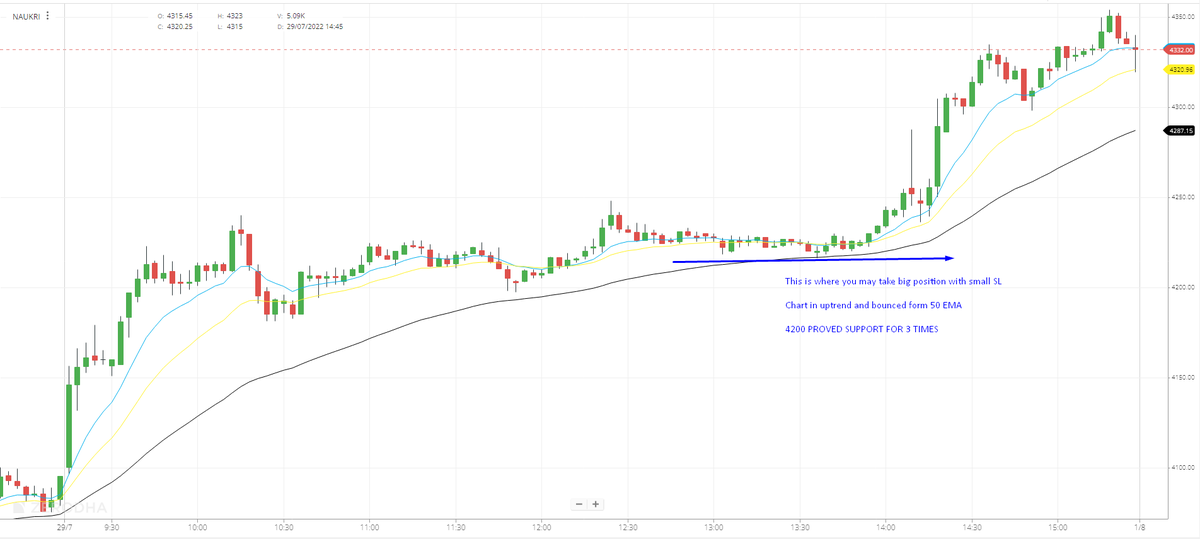
3) Still want to take Big Position size ??
Only when SL is very tight -
1) Naukri - Explained in chart
2) Reversal Big Quantity explained in BNF
4) Time frame mistakes -
Many beginners only trade with 3-5 min TF
Dude you know nothing in 3-5 min TF, its like taking trades from ground floor and pro traders checking daily TF are at 5th floor.
Their sight from 5th floor is better
Explained here
Time Frame importance -
— My First Stock (@myfirststock99) May 14, 2022
1) 3 min - For Execution
( indicators provide early signals and less reliable)
2) 15 min - to look at trend of week, Support and Resistance of last 4-5 days
3) Daily - to check current trend and Short Term S-R (More reliability)
Charts - pic.twitter.com/SWHcQQ8m0F
🧵
1. NR7 breakout scanner -
NR7 is a great concept using which you can identify the potential breakout candidates.
For details on NR& concept refer to this thread - https://t.co/EgC9h77bLl
Here's the scanner -
2. Volume & price shockers -
This scans the stocks that have seen a sudden rise in their volume by over 2x times the average volume of last 10 days and have gained or lost more than 5% today.
Great candidate for breakout /
3. 15 min breakouts -
These stocks have shown a rise in both prices as well as volume in the last 15 min. High chances that they will continue the rally
4. Engulfing Candle scan -
This scans the stocks which are in extended up/down trend & have formed Engulfing candle now. They are a great candidate to take reversal trades.
Bullish engulfing - https://t.co/4pOosoeMsL
Bearish engulfing -
Here are top 10 threads that will teach you about Stock Market:
1⃣How To Read a Stock Chart For Beginners by @RichardMoglen
👇
As Traders, Technical Analysis allows us to Judge Potential, Identify Accumulation, and Manage Risk.
— Richard Moglen \U0001f981 (@RichardMoglen) April 2, 2022
It allows us to see through the noise and interpret price action.
Here is How To Read a Stock Chart For Beginners (Thread)
2⃣The simple 8-step process to make a trading plan by @AdityaTodmal
The best traders have a trading plan.
— Aditya Todmal (@AdityaTodmal) February 13, 2022
But 98.8% of the new traders, don't know how to make one.
I analyzed @niki_poojary's account, to learn how we can create a plan on our own.
Here's the simple 8-step process:\U0001f9f5
3⃣Thread on Darvas Box Theory
Strategy to make higher returns in Short duration :-
— Flamingo Trader |Ankit Saraswat (@FlamingoTrader_) February 21, 2022
Thread on Darvas Box Theory:-
\U0001f9f5@FlamingoTrader_
2⃣How to find out high and lows of stock market by
Telling my 8 years of experience in 5 min. A thread on how to find out high and lows of stock market.
— W D Gann Trader (@Bjybnf) August 5, 2022


