
Before we discuss the indicator, let us understand an important concept.
Thread: Alligator indicator
#Alligator #Indicators #Definedge

Before we discuss the indicator, let us understand an important concept.
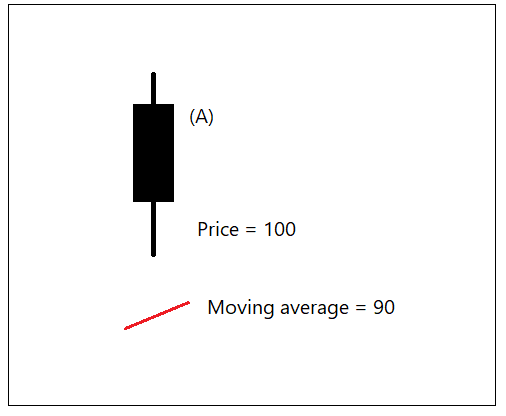
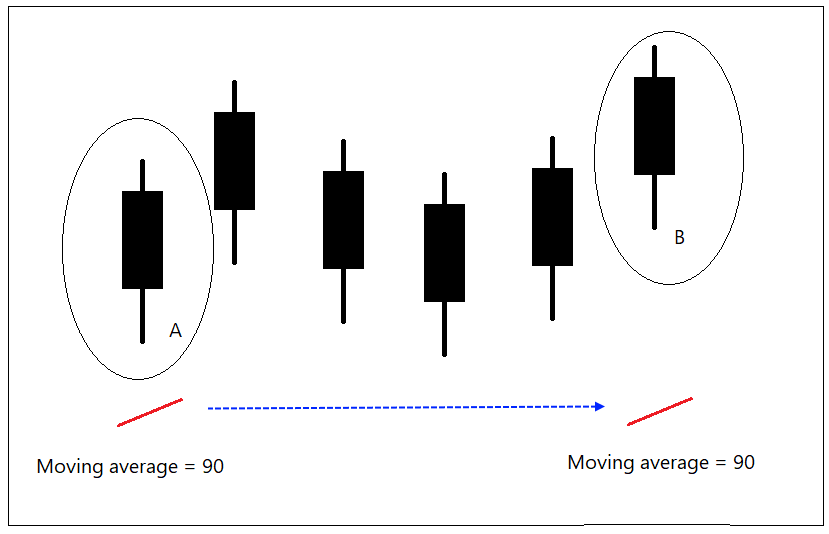
Moving average at bar B is moving average price of bar A (5 candles behind). This is shifting of moving average price. What does it mean?
https://t.co/WkNxKU9n8u
Let us discuss the Alligator indicator.
Thread:- How Ichimoku indicator is calculated. pic.twitter.com/pM7AZvJjMj
— Prashant Shah (@Prashantshah267) April 15, 2020
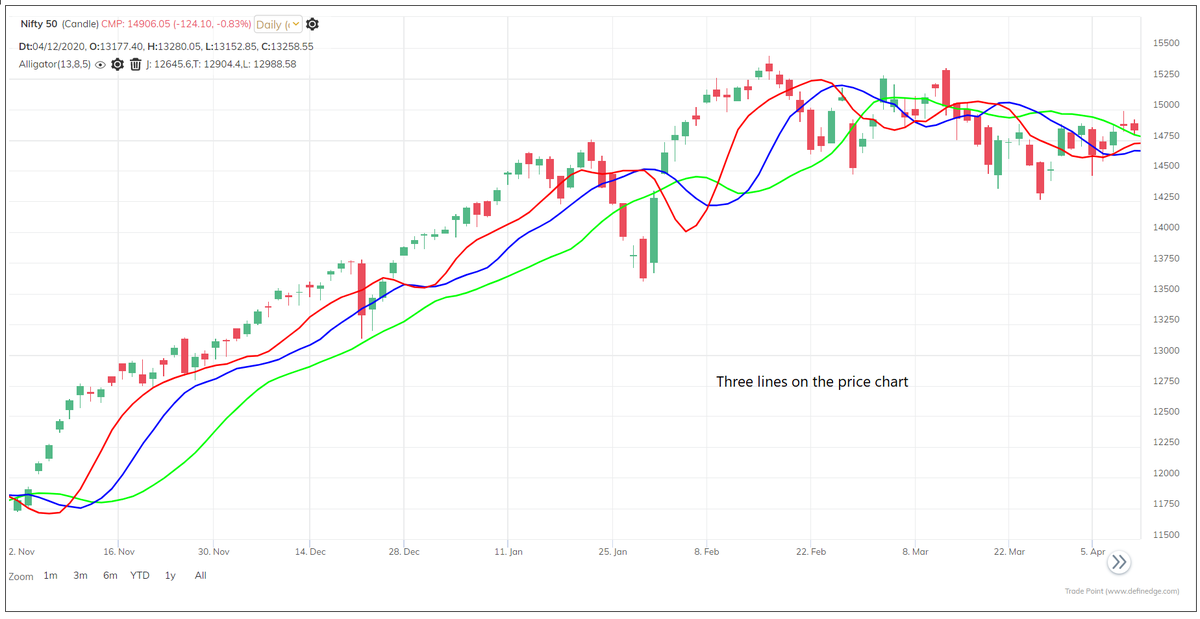
Williams suggested Fib numbers 13, 8 and 5 period averages.
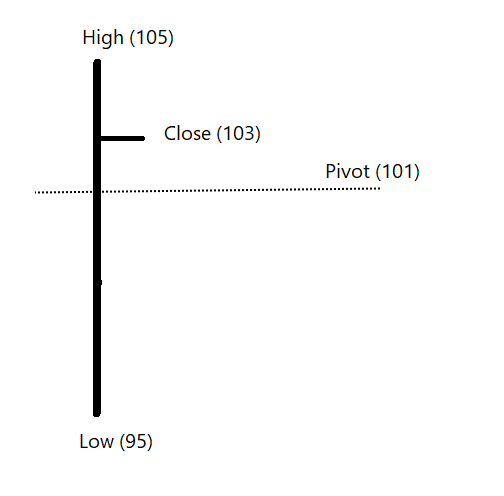
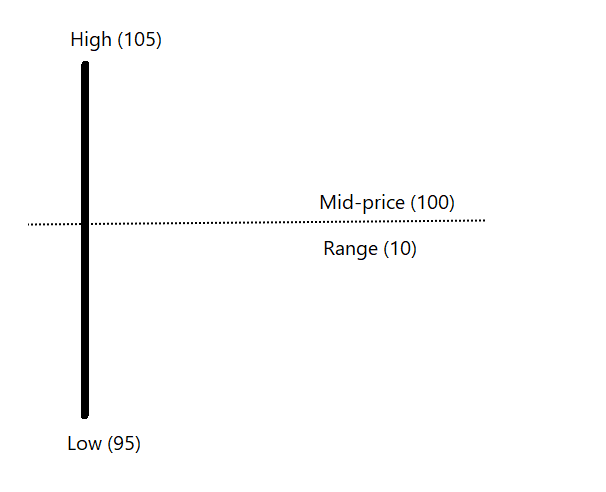
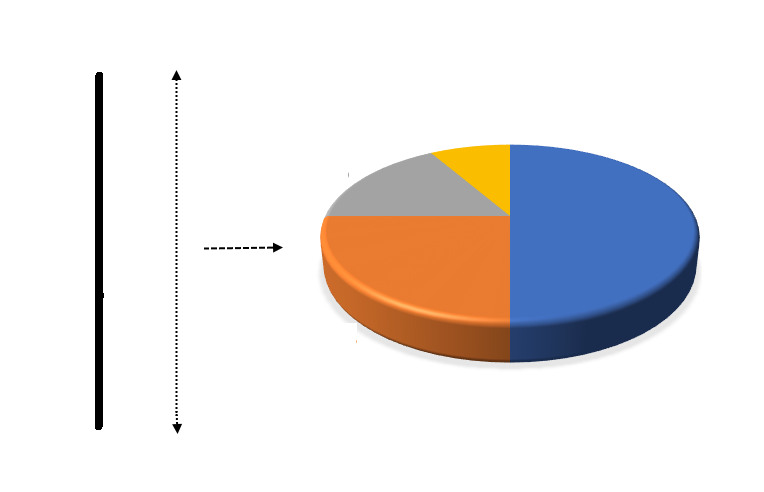
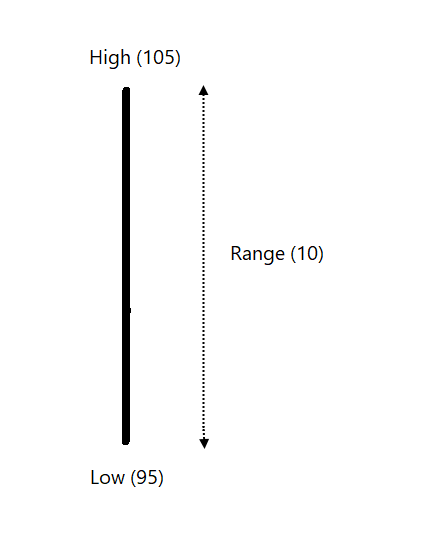
The averages are calculated on median price.
Median price = (High + low) / 2.
So, there are three lines plotted on the chart.
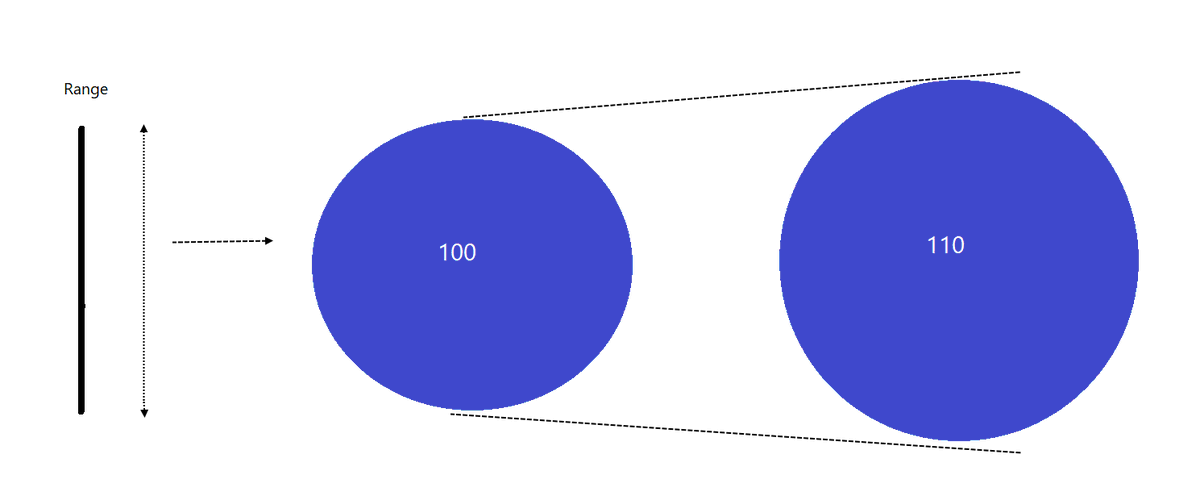
13-period MA is shifted by 8 bars
8-period MA is shifted by 5 bars
5-period MA is shifted by 3 bars
So, default parameters of Alligator indicator are 13,8,5 and 8,5,3.
The 13-period MA to 8 (13,8) is called as Alligator’s Jaws.
8-period MA to 5, the Teeth and
5-period MA to 3, the Lips.
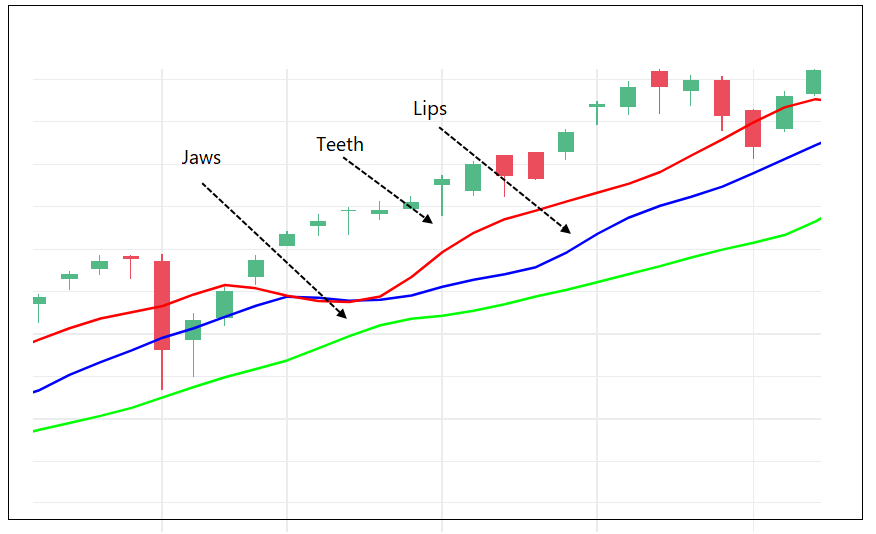
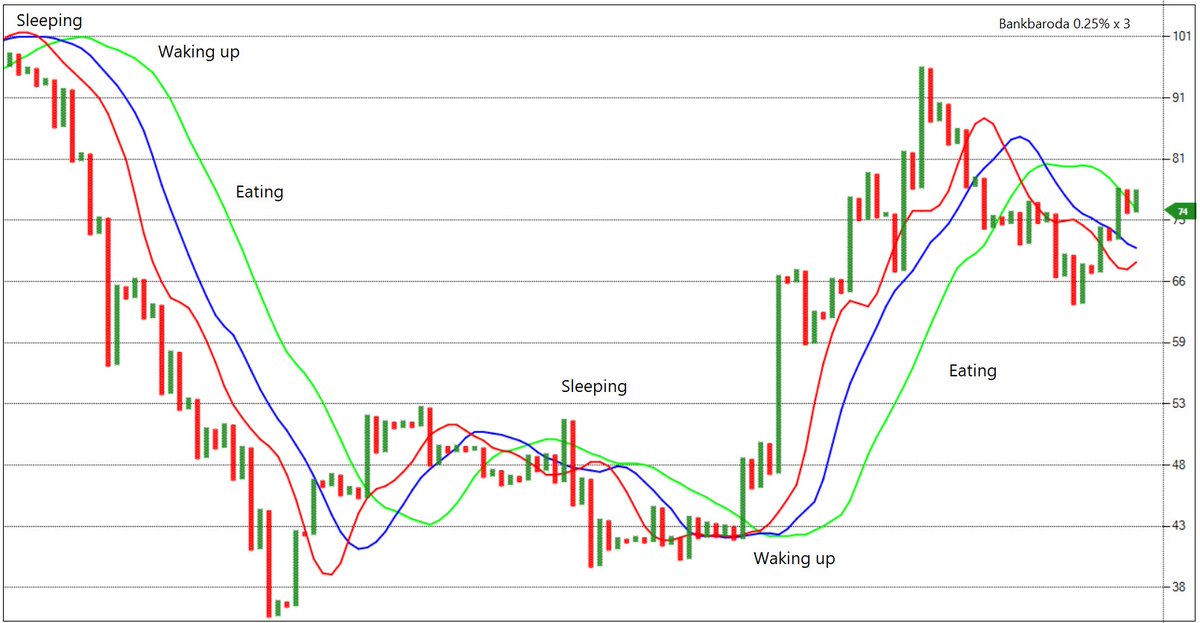
When three lines are close to each other, the Alligator is sleeping.
If the Lips crosses the Teeth and Jaws upward or downward, the Alligator is waking up.
If Price crosses above or below the three lines, the Alligator is eating.
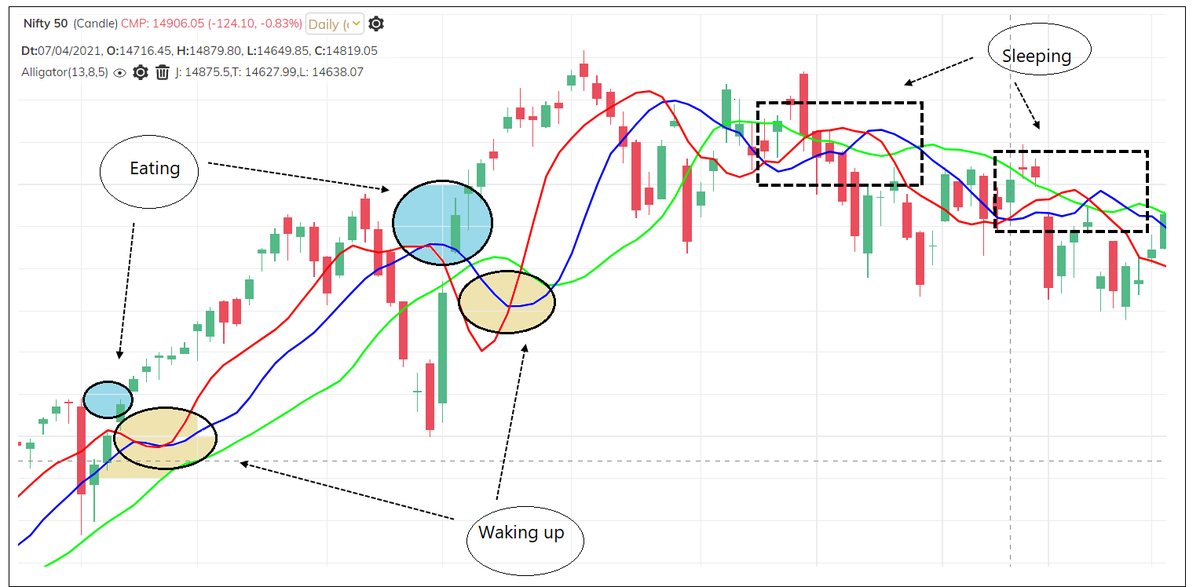
When three lines are close to each other, there is no clear trend.
When short-term average crosses other two upward or downward, the trend might emerge.
When three lines are trending, and price is above them, then it indicates strong uptrend.
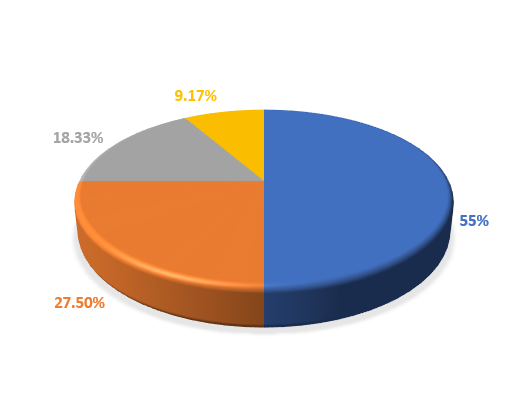
Over a period, market trends roughly 20% – 30% times, it remains in a range rest of the time.
If Alligator sleeps more (long consolidation), it will become hungrier and eat more (Strong trend).
There are two important observations on this indicator which I found useful:
2 – Price low is above three averages and all averages are rising = Strong up trend. Price high is below averages and all averages are falling = strong downtrend.
These readings are also possible using other indicators and charts. Idea was to talk about the concept.

More from Prashant Shah

More from Stockslearnings


Should you add more in Equity or redeem right now?
A thread 🧵to guide retail on why & what should they do at these historic market highs.
Do ‘re-tweet’ and help us educate more retail investors (1/n)
#investing #StockMarket
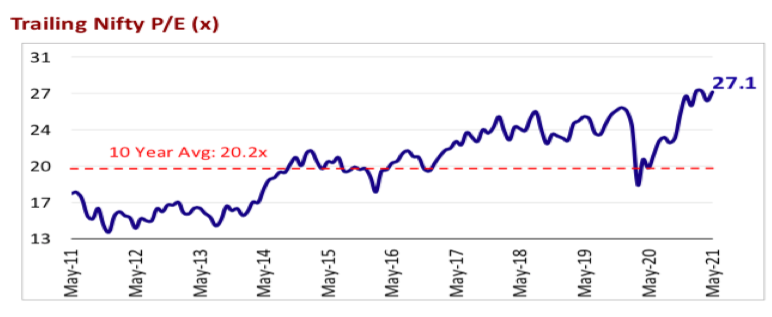
Some investors feel that markets are trading at a PE of 27 vs 10 years historical average of 20 and a market-cap to GDP of 105 vs historical average of 79 and hence markets look expensive (2/n)
But, in such crazy liquidity driven markets, prices can move much ahead of the fundamentals & suddenly we start hearing commentaries of how the market is pricing in the earnings of FY 22 & 23 to justify the rally
If you r new to fundamentals, 👇 can help
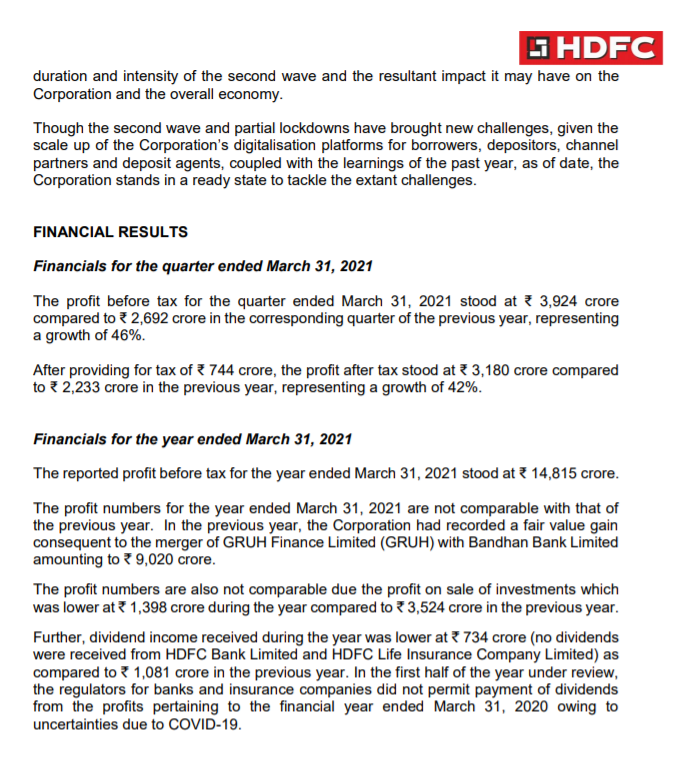
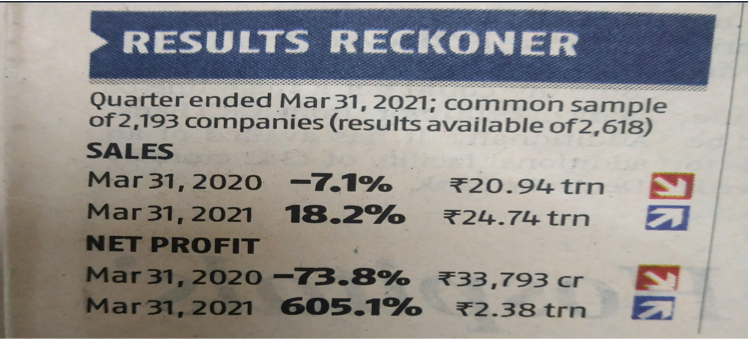
Results for Q4 have come out very well but that is also because of the lower base effect of the last year.
Over the last many years, markets have corrected 10-15% each calendar year. Can it happen this year as well? Can very much and that can be a great entry point. Why? (4/n)
There are a lot of over hangs in the near term,
-Crude going up
-$ index moving up
-Inflation moving up
-COVID uncertainties
All of the above are –ve for markets & liquidity on the other side driving markets up, its impossible to judge the near term movement of the markets (5/n)
A thread 🧵to guide retail on why & what should they do at these historic market highs.
Do ‘re-tweet’ and help us educate more retail investors (1/n)
#investing #StockMarket
Some investors feel that markets are trading at a PE of 27 vs 10 years historical average of 20 and a market-cap to GDP of 105 vs historical average of 79 and hence markets look expensive (2/n)
But, in such crazy liquidity driven markets, prices can move much ahead of the fundamentals & suddenly we start hearing commentaries of how the market is pricing in the earnings of FY 22 & 23 to justify the rally
If you r new to fundamentals, 👇 can help
Market PE at 40 and yet the market is not falling, why? Getting asked this question multiple times. Here's a thread covering \u2018very basic\u2019 premier on valuation for my retail investor friends.
— Kirtan A Shah (@KirtanShahCFP) January 14, 2021
Do hit the \u2018re-tweet\u2019 and help us educate more investors (1/n) pic.twitter.com/8oCkBmmOXY
Results for Q4 have come out very well but that is also because of the lower base effect of the last year.
Over the last many years, markets have corrected 10-15% each calendar year. Can it happen this year as well? Can very much and that can be a great entry point. Why? (4/n)
There are a lot of over hangs in the near term,
-Crude going up
-$ index moving up
-Inflation moving up
-COVID uncertainties
All of the above are –ve for markets & liquidity on the other side driving markets up, its impossible to judge the near term movement of the markets (5/n)
You May Also Like

1/12
RT-PCR corona (test) scam
Symptomatic people are tested for one and only one respiratory virus. This means that other acute respiratory infections are reclassified as
2/12
It is tested exquisitely with a hypersensitive non-specific RT-PCR test / Ct >35 (>30 is nonsense, >35 is madness), without considering Ct and clinical context. This means that more acute respiratory infections are reclassified as
3/12
The Drosten RT-PCR test is fabricated in a way that each country and laboratory perform it differently at too high Ct and that the high rate of false positives increases massively due to cross-reaction with other (corona) viruses in the "flu
4/12
Even asymptomatic, previously called healthy, people are tested (en masse) in this way, although there is no epidemiologically relevant asymptomatic transmission. This means that even healthy people are declared as COVID
5/12
Deaths within 28 days after a positive RT-PCR test from whatever cause are designated as deaths WITH COVID. This means that other causes of death are reclassified as
RT-PCR corona (test) scam
Symptomatic people are tested for one and only one respiratory virus. This means that other acute respiratory infections are reclassified as
4/10
— Dr. Thomas Binder, MD (@Thomas_Binder) October 22, 2020
...indication, first of all that testing for a (single) respiratory virus is done outside of surveillance systems or need for specific therapy, but even so the lack of consideration of Ct, symptoms and clinical findings when interpreting its result. https://t.co/gHH6kwRdZG
2/12
It is tested exquisitely with a hypersensitive non-specific RT-PCR test / Ct >35 (>30 is nonsense, >35 is madness), without considering Ct and clinical context. This means that more acute respiratory infections are reclassified as
6/10
— Dr. Thomas Binder, MD (@Thomas_Binder) October 22, 2020
The neither validated nor standardised hypersensitive RT-PCR test / Ct 35-45 for SARS-CoV-2 is abused to mislabel (also) other diseases, especially influenza, as COVID-19.https://t.co/AkFIfTCTkS
3/12
The Drosten RT-PCR test is fabricated in a way that each country and laboratory perform it differently at too high Ct and that the high rate of false positives increases massively due to cross-reaction with other (corona) viruses in the "flu
External peer review of the RTPCR test to detect SARS-CoV-2 reveals 10 major scientific flaws at the molecular and methodological level: consequences for false positive results.https://t.co/mbNY8bdw1p pic.twitter.com/OQBD4grMth
— Dr. Thomas Binder, MD (@Thomas_Binder) November 29, 2020
4/12
Even asymptomatic, previously called healthy, people are tested (en masse) in this way, although there is no epidemiologically relevant asymptomatic transmission. This means that even healthy people are declared as COVID
Thread web\u2b06\ufe0f\u2b07\ufe0f
— Dr. Thomas Binder, MD (@Thomas_Binder) December 16, 2020
The fabrication of the "asymptomatic (super) spreader" is the coronation of the total nons(ci)ense in the belief system of #CoronasWitnesses.
Asymptomatic transmission 0.7%; 95% CI 0%-4.9% - could well be 0%!https://t.co/VeZTzxXfvT
5/12
Deaths within 28 days after a positive RT-PCR test from whatever cause are designated as deaths WITH COVID. This means that other causes of death are reclassified as
8/8
— Dr. Thomas Binder, MD (@Thomas_Binder) March 24, 2020
By the way, who the f*** created this obviously (almost) worldwide definition of #CoronaDeath?
This is not only medical malpractice, this is utterly insane!https://t.co/FFsTx4L2mw


First thread of the year because I have time during MCO. As requested, a thread on the gods and spirits of Malay folk religion. Some are indigenous, some are of Indian origin, some have Islamic
Before I begin, it might be worth explaining the Malay conception of the spirit world. At its deepest level, Malay religious belief is animist. All living beings and even certain objects are said to have a soul. Natural phenomena are either controlled by or personified as spirits
Although these beings had to be respected, not all of them were powerful enough to be considered gods. Offerings would be made to the spirits that had greater influence on human life. Spells and incantations would invoke their
Two known examples of such elemental spirits that had god-like status are Raja Angin (king of the wind) and Mambang Tali Arus (spirit of river currents). There were undoubtedly many more which have been lost to time
Contact with ancient India brought the influence of Hinduism and Buddhism to SEA. What we now call Hinduism similarly developed in India out of native animism and the more formal Vedic tradition. This can be seen in the multitude of sacred animals and location-specific Hindu gods
i wonder if you can make a thread bout witchcraft in malaysia.. or list of our own local gods/deites..
— r a y a \U0001f319 (@lcvelylilith) February 20, 2020
Before I begin, it might be worth explaining the Malay conception of the spirit world. At its deepest level, Malay religious belief is animist. All living beings and even certain objects are said to have a soul. Natural phenomena are either controlled by or personified as spirits
Although these beings had to be respected, not all of them were powerful enough to be considered gods. Offerings would be made to the spirits that had greater influence on human life. Spells and incantations would invoke their
Animist ceremonies of a religious or magical nature were normally held for the purpose of divination or making a request. This would either be done at a keramat or at a shrine similar to the Thai spirit houses or Chinese roadside shrines pic.twitter.com/I1hliyi0x3
— \u2745\u1710\u170b\u1713\u170e (@uglyluhan) June 16, 2019
Two known examples of such elemental spirits that had god-like status are Raja Angin (king of the wind) and Mambang Tali Arus (spirit of river currents). There were undoubtedly many more which have been lost to time
Contact with ancient India brought the influence of Hinduism and Buddhism to SEA. What we now call Hinduism similarly developed in India out of native animism and the more formal Vedic tradition. This can be seen in the multitude of sacred animals and location-specific Hindu gods