Thread: Camarilla Levels
Continuing our discussion on pivot levels, we look at the Camarilla levels which is another widely followed tool.
Word ‘Camarilla’ is borrowed from Spanish. It translates to a group of confidential & private advisers of the King or person in authority.
The Camarilla equation was first developed by a bond trader named Nick Scott in 1989. It is said that he didn't disclose the equation, but people studied the levels & reverse engineered it to find the formula. There r different versions of this formula.
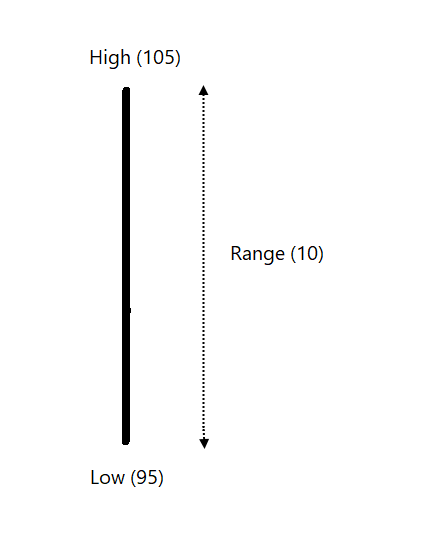
We discussed about ‘Range’ in the earlier thread. The range is basically the difference between High & Low of the session.
High – Low = Range of the session
Continuing with the same levels as an example, If High of the day is 105 and Low is 95, Range of the session is 10 points.
Range shows us activity during the session irrespective of the trend.
Narrow range = Not much movement
Wide Range = Strong activity
Camarilla calculation depends on the Range of the session.
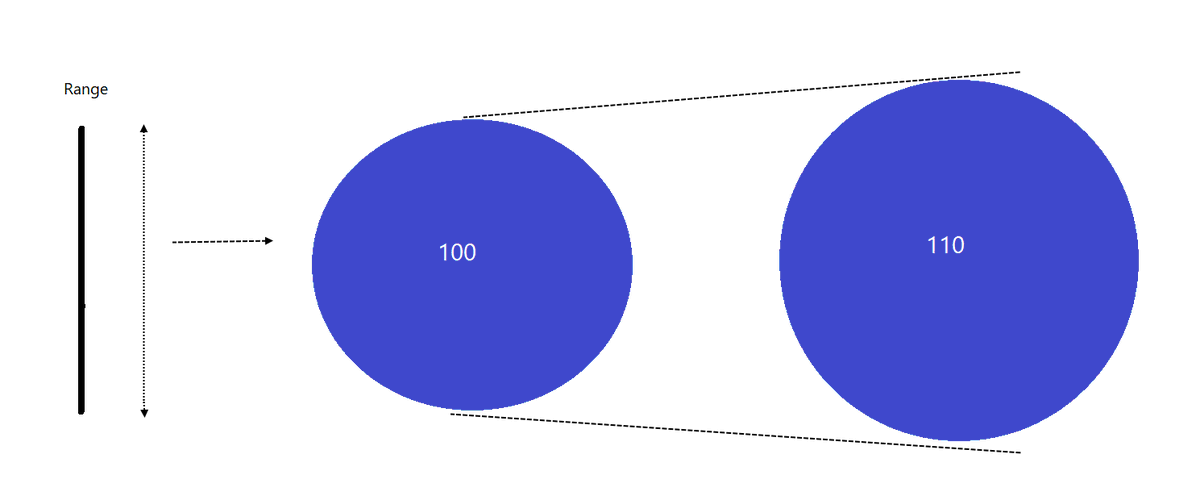
Let’s expand the range to 110%. If Current range is 10, let us make it 11.
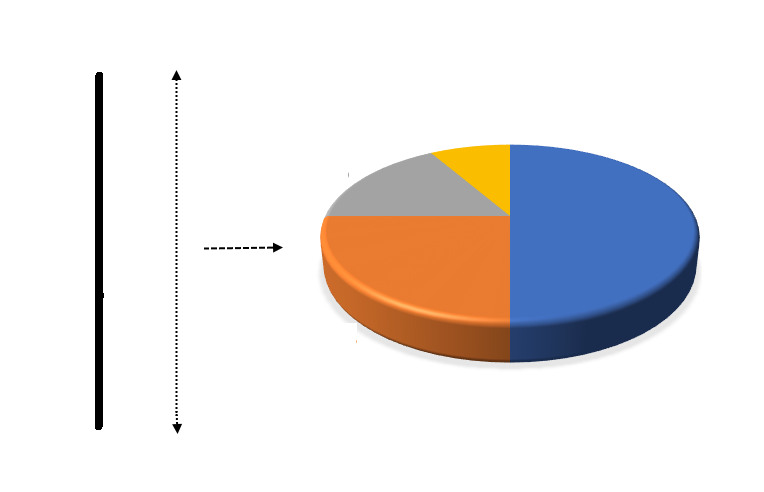
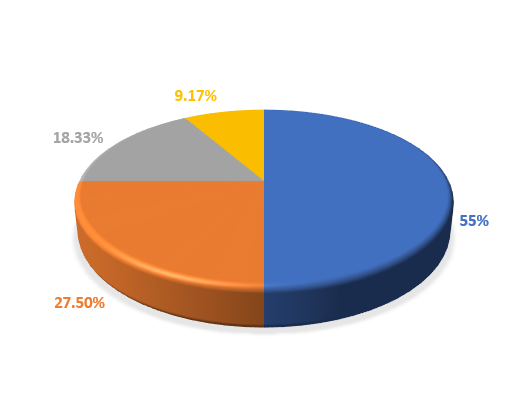
Let’s now divide this Range in four parts.
9.17%, 18.33%, 27.50% and 55% of the range.
So, if Range is 10 points:
10 x 9.17% = 0.92
10 x 18.33% = 1.83
10 x 27.50% = 2.75
10 x 55% = 5.50