2) July to Aug: IT consolidating, metals outperforming.
3) Aug to Oct: IT moving up, metals under retracement.
(2/4)

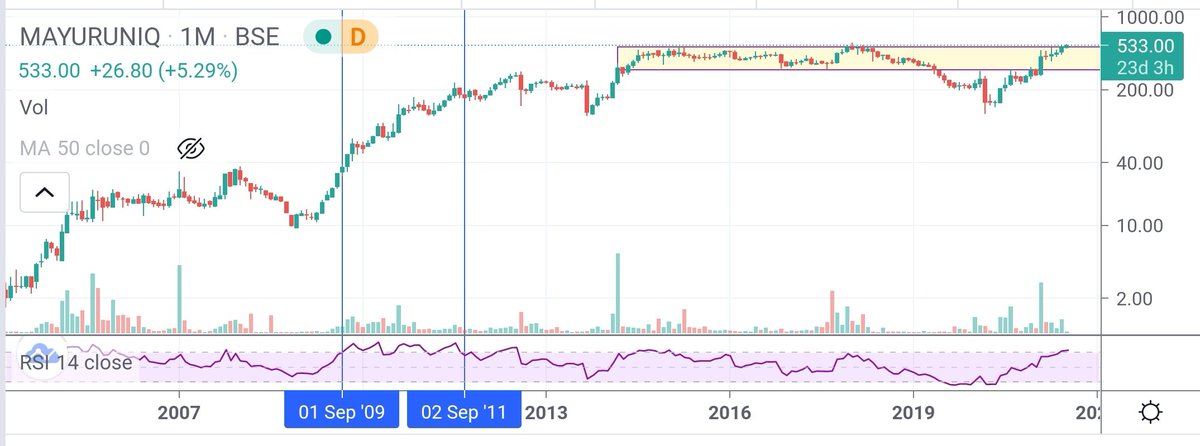
Spot the similarities here in the price action:#AARTIDRUGS
— Mayank Narula (@Mayank_Narula1) October 10, 2020
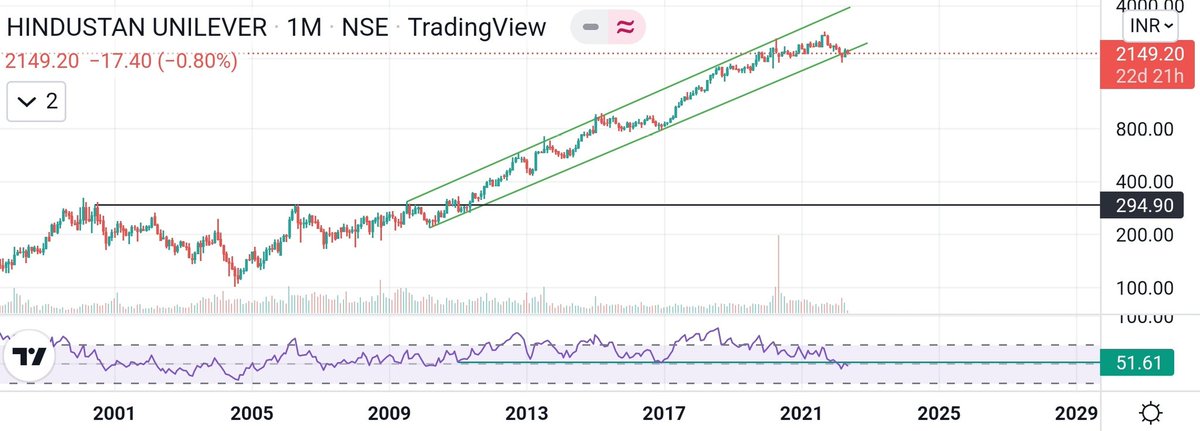
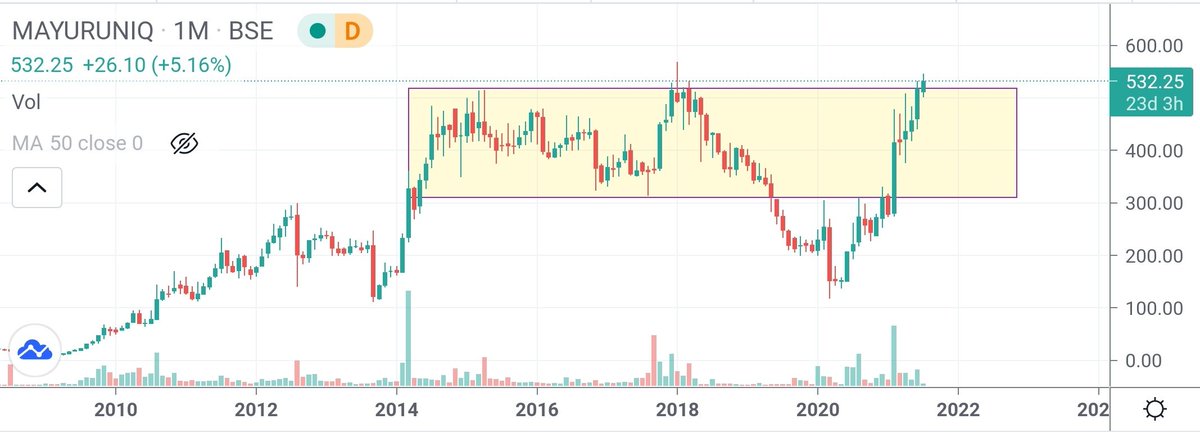
2013-2015: Monthly RSI goes over 70 and stock goes up 4-5x.
2015-2020: range consolidation
2020: repeat of 2013-15 in few months pic.twitter.com/53L2fNpJoM
1/
— 10-K Diver (@10kdiver) October 23, 2021
Get a cup of coffee.
In this thread, I'll walk you through Shannon's Demon.
This is an investing "thought exercise" -- posed by the great scientist Claude Shannon.
Solving this exercise can teach us a lot about favorable vs unfavorable long-term bets, position sizing, etc.
How to find out the expected targets and what should be the exit criteria when you enter a trade - \U0001f9f5
— Sheetal Rijhwani (@RijhwaniSheetal) October 25, 2021
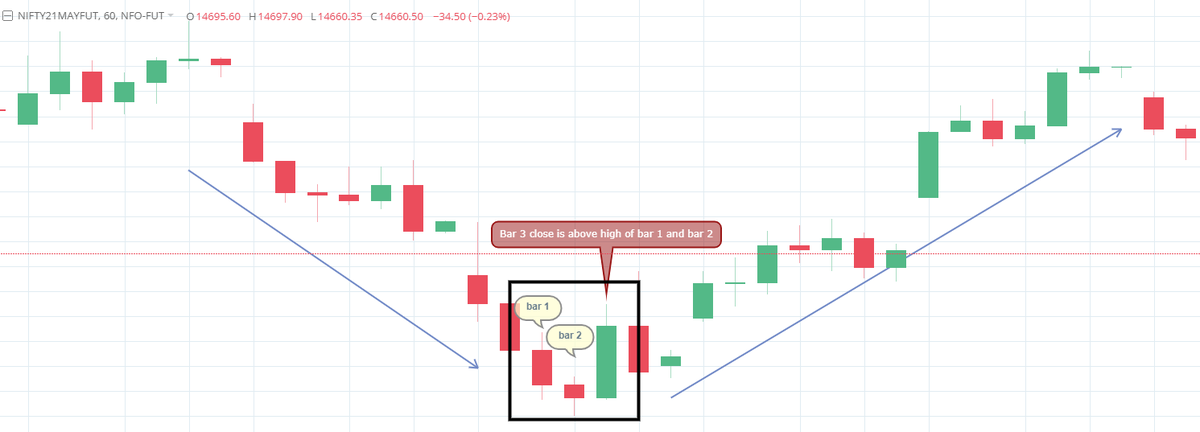
Possible ways to find out the target:
Check if any patterns forming - it gets quite easy to figure out the targets that way. (1/15)
Trading view scanner process -
— Vikrant (@Trading0secrets) October 23, 2021
1 - open trading view in your browser and select stock scanner in left corner down side .
2 - touch the percentage% gain change ( and u can see higest gainer of today) https://t.co/GGWSZXYMth
The 90 degree angle inflection point in a stock is a signal to book profit
— Nikita Poojary (@niki_poojary) October 24, 2021
Lets understand with a recent example of a stock #IRCTC \U0001f683\U0001f68b
Time for a thread\U0001f9f5
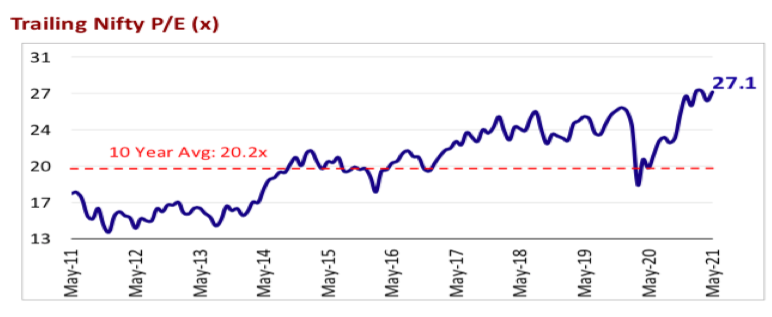
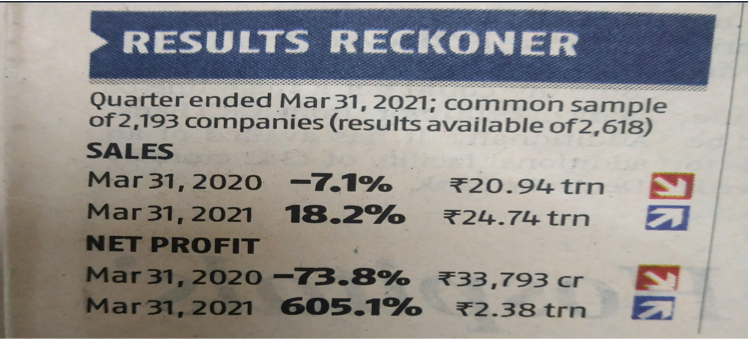
Market PE at 40 and yet the market is not falling, why? Getting asked this question multiple times. Here's a thread covering \u2018very basic\u2019 premier on valuation for my retail investor friends.
— Kirtan A Shah (@KirtanShahCFP) January 14, 2021
Do hit the \u2018re-tweet\u2019 and help us educate more investors (1/n) pic.twitter.com/8oCkBmmOXY

Project: Lifelog
— Robert Horan (@Robby12692) December 13, 2018
Started by DARPA in 1999, the goal of Lifelog was to create a database on civilians without their knowledge, and track everything they do.
The project "ended" on Feb 4th, 2004.
Facebook began the exact same day.
The CIA funneled tens of millions into Facebook. pic.twitter.com/r7hwF0v9kh