10 websites you didn't know you were missing (until now) :

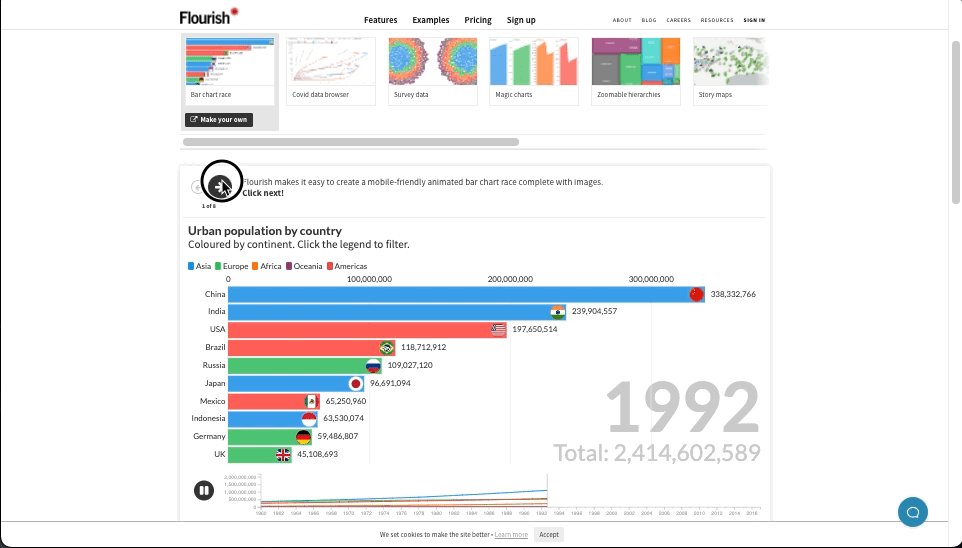
https://t.co/vC0nCFDmk0

People are visual learners.

Easily turn your data into stunning charts, maps, and interactive stories.

Upload a spreadsheet, and return with:

• Animated bar charts
• Survey data
• Scatter plots
• Story maps & more
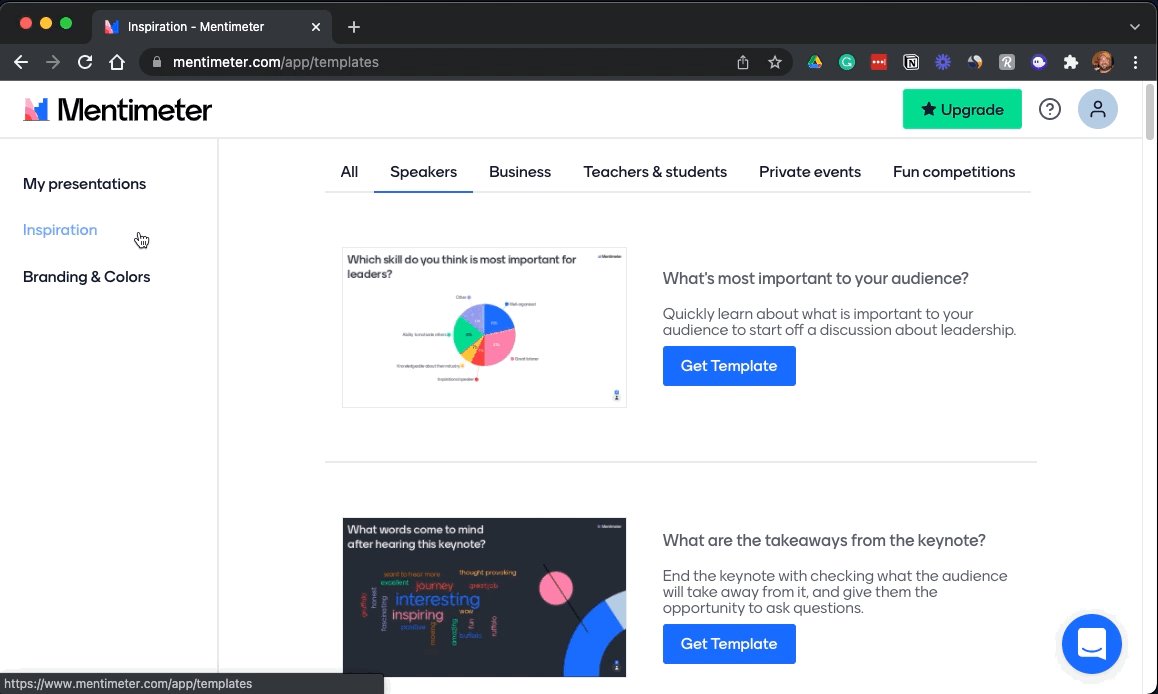
https://t.co/g9YBl2ELwq

Looking for a way to make your presentations more engaging?

Build interactive polls, quizzes, and more allowing your audience to engage in real-time.

Using their smartphone, attendees can answer questions and the results are visualized as they happen.
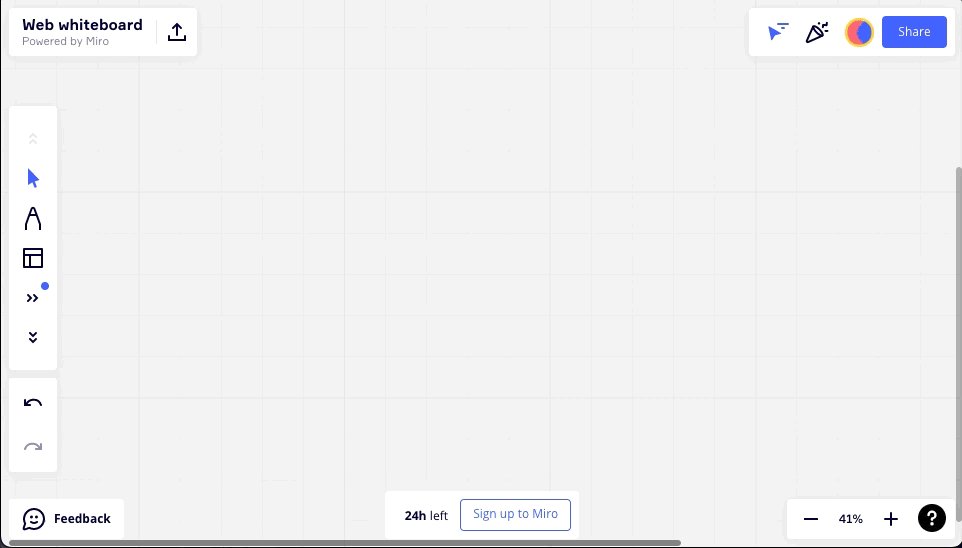
https://t.co/wsUNfyHzFb

An online collaborative whiteboard ideal for remote meetings, brainstorming, and ideation across teams.

• Make flowcharts
• Build product roadmaps
• Engage in a quick retrospective

The best part?

It's free.
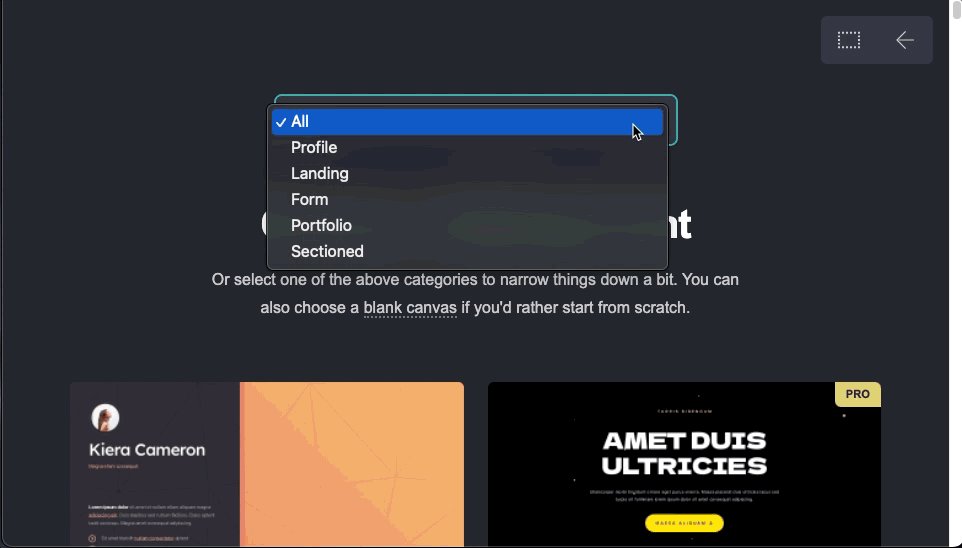
https://t.co/RxDEsvPB2w

My friend @thejustinwelsh brought this site to my attention recently.

If you're in the solopreneur game and need to spin up a quick landing page or website for just about anything, Carrd is tough to beat.

Simple, free, mobile responsive.

Check 'em out.
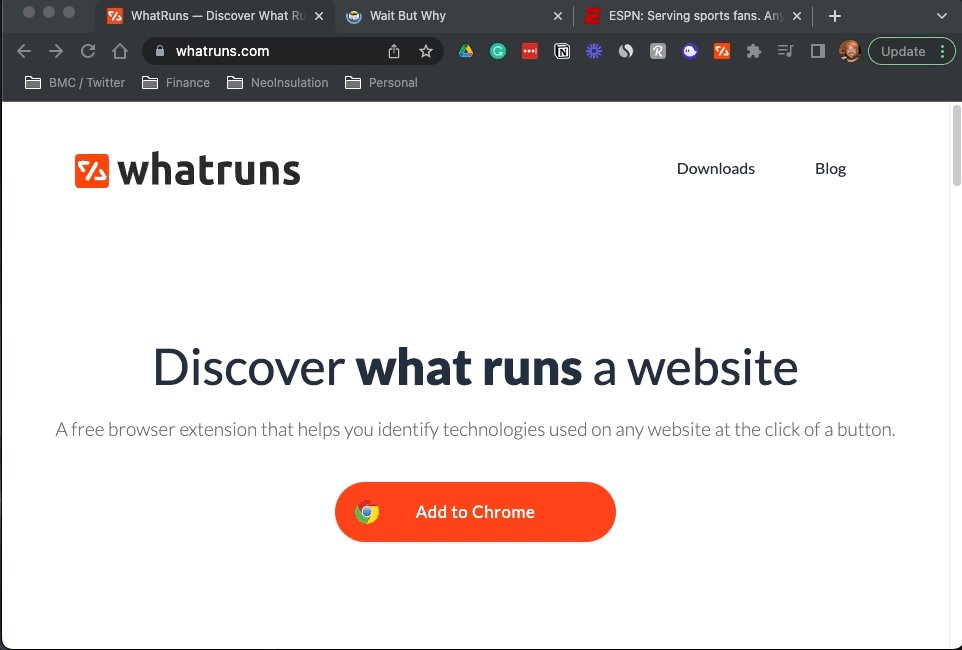
https://t.co/PUlPxjieyi

Here's one for the nerds (like me).

Ever wondered what tech stack is running that cool website you're viewing?

With 'whatruns' it's easy.

Once you have the Chrome extension installed, just click the icon & see everything behind the scenes.

Like this:
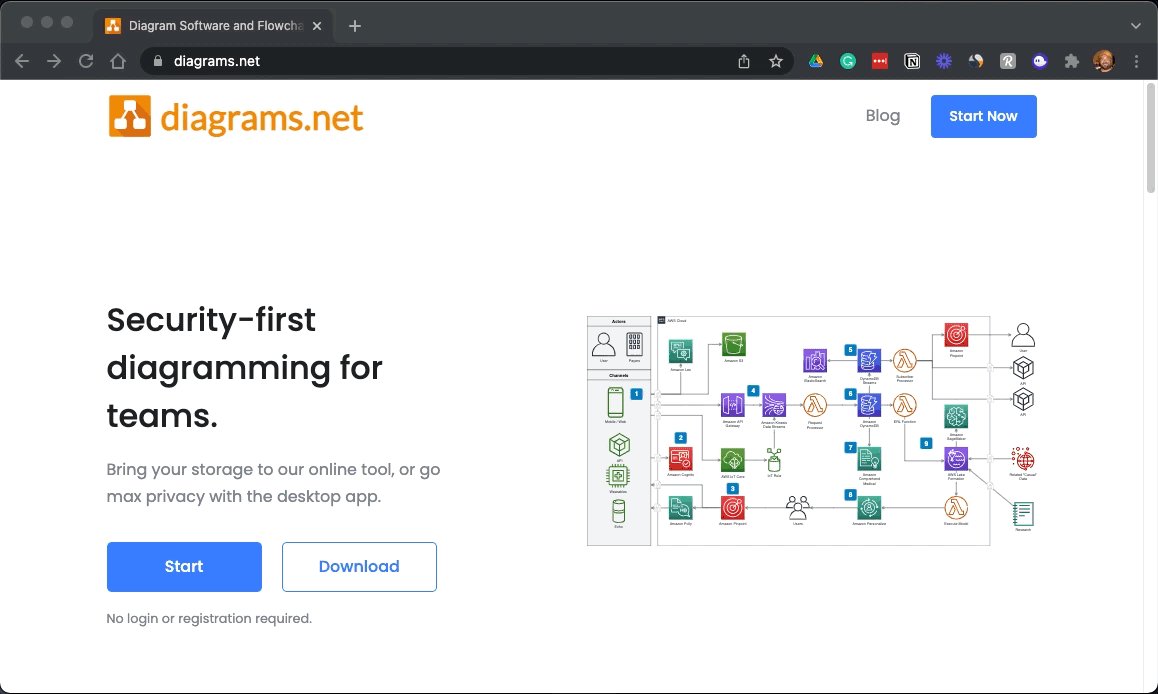
https://t.co/s9sbOvDGdv

A free and open-source graph drawing software developed in HTML5 and JavaScript.

Its interface can be used to create diagrams such as flowcharts, wireframes, UML diagrams, and organizational charts.

No login to create and no account required.
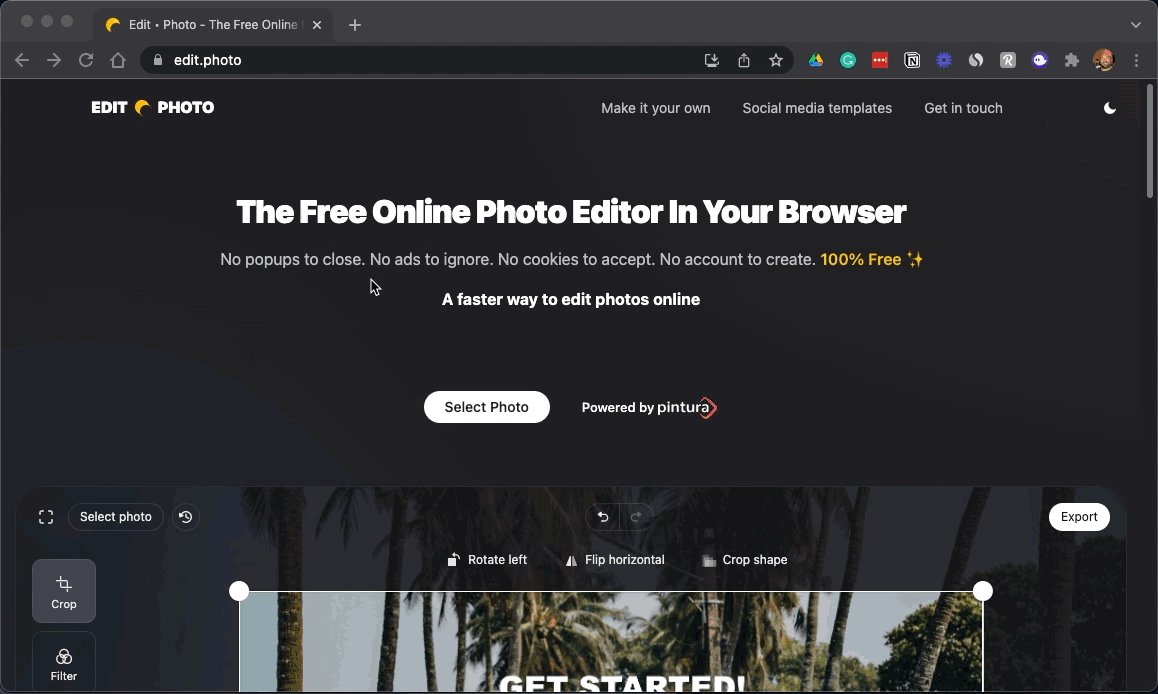
https://t.co/CPHIaJ4yW8

A free online photo editor you can use directly in your browser.

No ads, no account to create, no cookies to accept.

Just drag, drop, edit, and save.
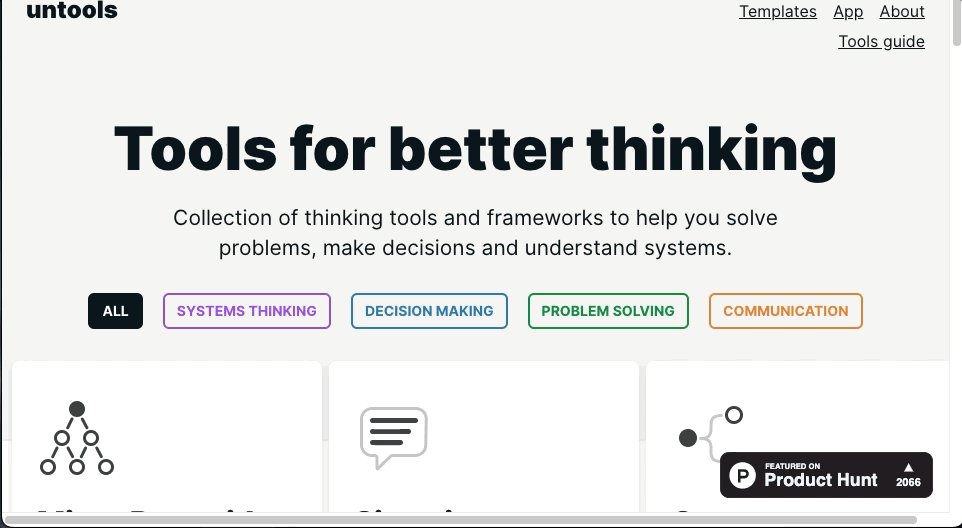
https://t.co/MCtLVhp2Uw

There's no denying that mental models, frameworks, and tools to help you make better decisions are super popular.

With untools, you get a categorized list:

• Mental models
• Instructions on how they're used
• Examples you can put into practice.
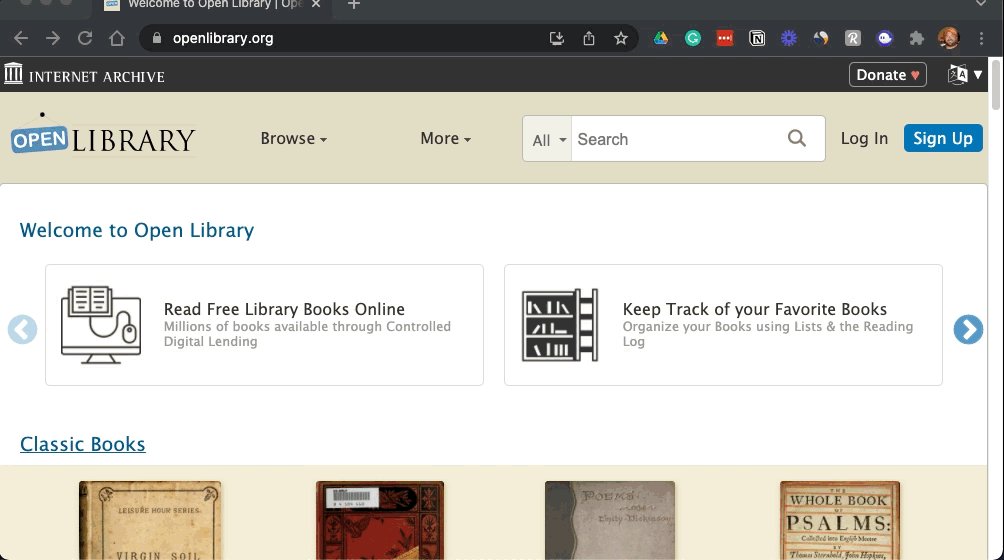
https://t.co/F4CMCeIWqn

Millions of books: Available for free.

Booklists seem to be all the rage recently on Twitter.

(I'm guilty of posting a couple myself)

Instead of a list, here's a link to a library full of them.

The goal:
"A web page for every book ever published."
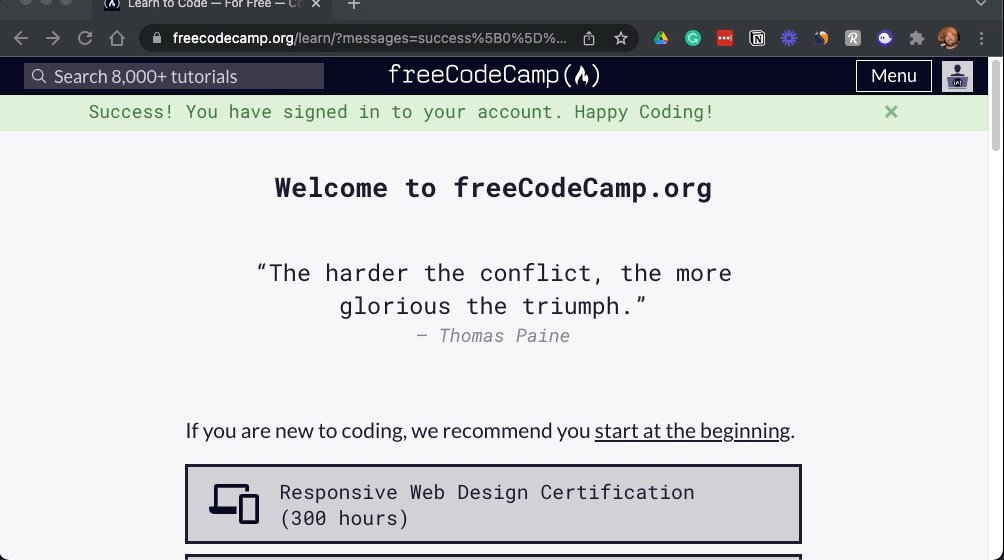
https://t.co/mOFGsJ1NxF

Learn to code for free:

It's never too late to learn a new skill & I think it's safe to say, computers aren't going away anytime soon.

HTML, CSS, Python & more.

They also have an awesome YouTube channel with 1,000's of hours of instructional videos.
Bonus: 
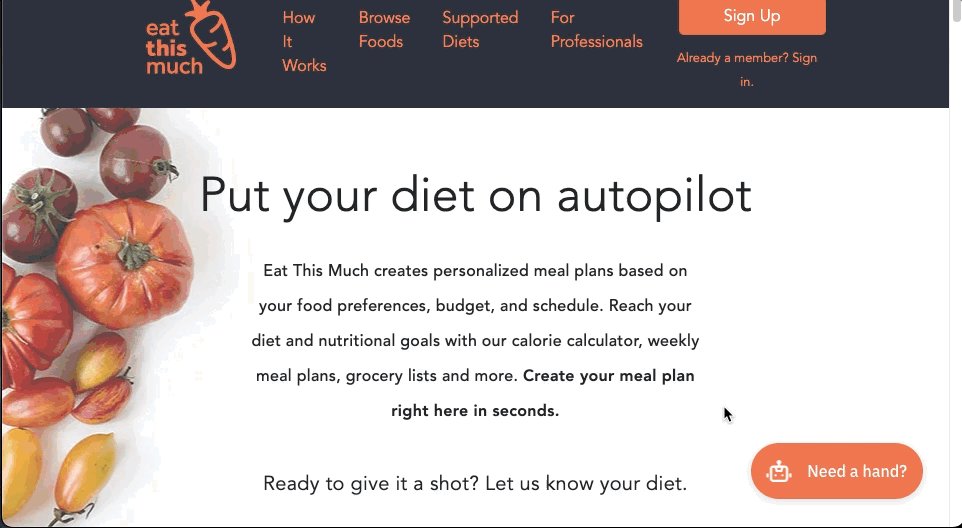
https://t.co/86cQHaQgUA

Put your diet on autopilot.

Create a free, personalized meal plan based on:

• Food preferences
• Diet type
• Budget
• Schedule

Eating smart has never been easier.
That's it for today!

Follow me @blakeaburge for weekly threads on business & productivity.

Join 12,500+ others & check out my newsletter––It's free!

•The best of Twitter
•In your Inbox
•Every Sunday
https://t.co/KPDWcXYbFv
If you enjoyed finding a few sites you were missing, you might enjoy finding a Twitter account or two you're missing out on as well.

Here's one of my favorites.

@wdmorrisjr dropping knowledge on a regular basis,

Def, worth a follow.
https://t.co/OKdYVIYS27

More from Blake Burge 💡

Google Sheets isn't Excel...

But it's more powerful than you think.

8 things Google Sheets can do, you'll wish you knew yesterday. 📊

Translate Text:

Need to convert data from one language to another?

Enter:
=GOOGLETRANSLATE("A2","en","es")

This will translate the words in cell "A2" from English to Spanish.

Replace "en" with "auto" and Sheets will identify the source language automatically.


Timesavers:

Assuming you're signed in to your Google account, head on up to your browser's address bar:

From there type: "
https://t.co/BeKgYV7g31"

Boom! A new Google sheet is created for you on the fly from anywhere on the web.

(Works for docs too)

Pretty cool!


Sparklines:

Easily visualize data trends by adding sparklines to your sheet.

To add a basic "mini-graph" inside a cell, it's as simple as inputting:

=SPARKLINE (A1:F1) – (Where A1:F1 represents your range of data.)

For more detailed options, check this out:👇🏻


Explore:

Need to do some number crunching?

Let Google's AI do the work for you.

•Highlight the range of data.

•Move your cursor to the starburst shaped icon in the bottom right corner.

•Click "Explore" – Complex charts, analytics, & detailed info. generated automatically.

More from Website

10 insanely useful websites you’ll be kicking yourself you didn’t know (until now):

#1:
https://t.co/0TQkimtKgY

No more expensive photo editors.

Welcome to a free online photo editor in your browser.

What? Yes, that’s right.
• No popups
• No ads
• No cookies
• No account to create
• 100% free

Just select a photo and get going!


#2: https://t.co/mfr6V6kztv

Tame the firehose of information with one daily email that curates all your favourite sources and links in one place.

You’ll get:
• Emails
• Twitter Accounts
• YouTube Channels

Staying on top of good information has never been easier.


#3: https://t.co/rjquIV2eXs

Looking to meet like-minded people but don’t know where to start?

Welcome to The Hive Index: A directory of online communities.

Find communities organized by topics, across all major platforms:
• Reddit
• Discord
• Slack
• Facebook


#4: https://t.co/nYfOIbZzr0

Read the entire internet on a single page.

Upstract has headlines and links to the most popular news sites in the world:

• Reddit
• Reuters
• NY Times
• YouTube
• Vice
• Buzzfeed

Never miss a beat.

You May Also Like

TradingView isn't just charts

It's much more powerful than you think

9 things TradingView can do, you'll wish you knew yesterday: 🧵

Collaborated with @niki_poojary

1/ Free Multi Timeframe Analysis

Step 1. Download Vivaldi Browser

Step 2. Login to trading view

Step 3. Open bank nifty chart in 4 separate windows

Step 4. Click on the first tab and shift + click by mouse on the last tab.

Step 5. Select "Tile all 4 tabs"


What happens is you get 4 charts joint on one screen.

Refer to the attached picture.

The best part about this is this is absolutely free to do.

Also, do note:

I do not have the paid version of trading view.


2/ Free Multiple Watchlists

Go through this informative thread where @sarosijghosh teaches you how to create multiple free watchlists in the free


3/ Free Segregation into different headers/sectors

You can create multiple sections sector-wise for free.

1. Long tap on any index/stock and click on "Add section above."
2. Secgregate the stocks/indices based on where they belong.

Kinda like how I did in the picture below.