Let us think about creating an indicator that shows the trend.
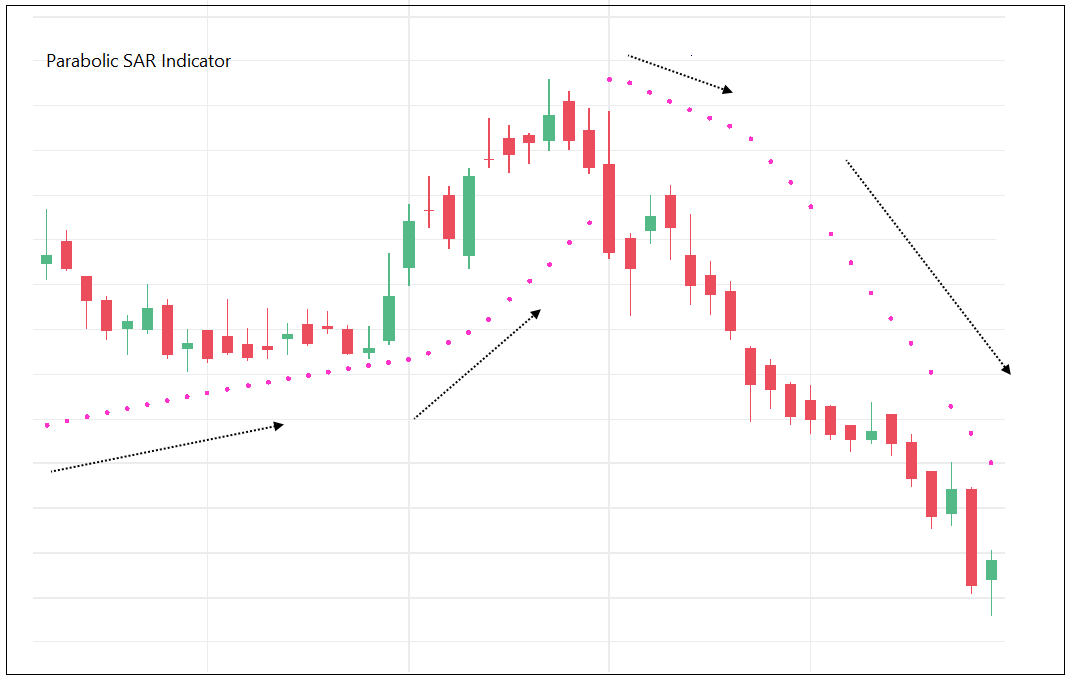
Thread: Parabolic SAR Indicator
Parabolic SAR (PSAR) indicator was developed by J. Welles Wilder.
#PSAR #Indicators #Definedge
Let us think about creating an indicator that shows the trend.
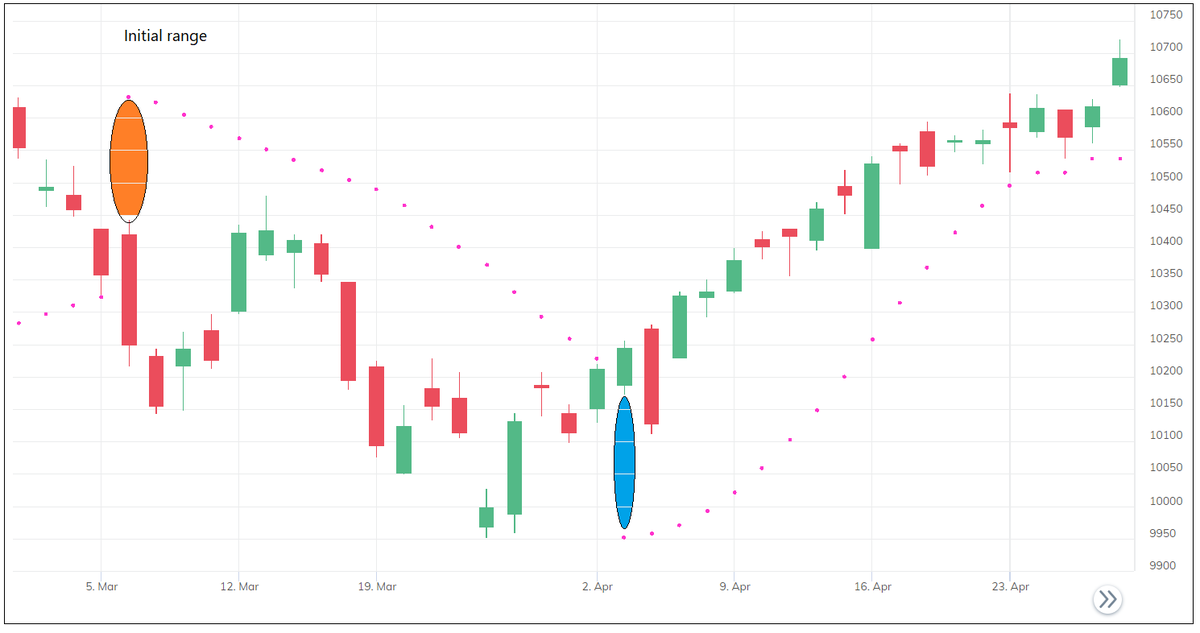
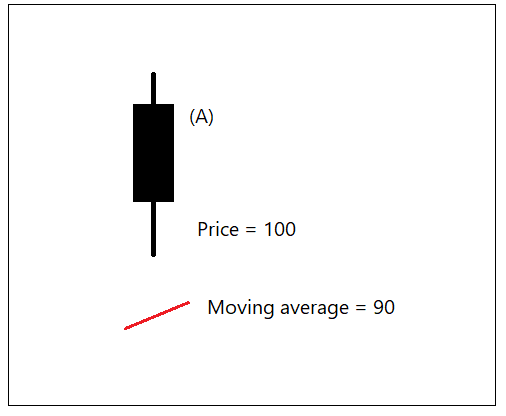
For trailing the stop in uptrend, indicator needs to be placed below the candle. Similarly, it should be placed above the candle for trailing in a downtrend. We will plot it using ‘dots’.
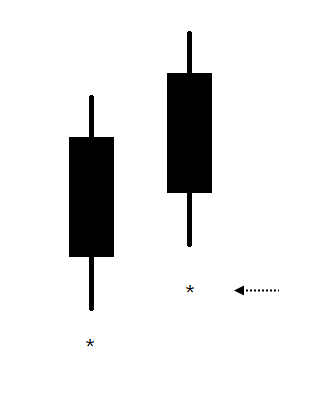
Let us define the trend as:
If Low of the candle > Stop-loss level in bull market = Trend remains bullish.
If High of the candle < Stop-loss level in bear market = Trend is bearish
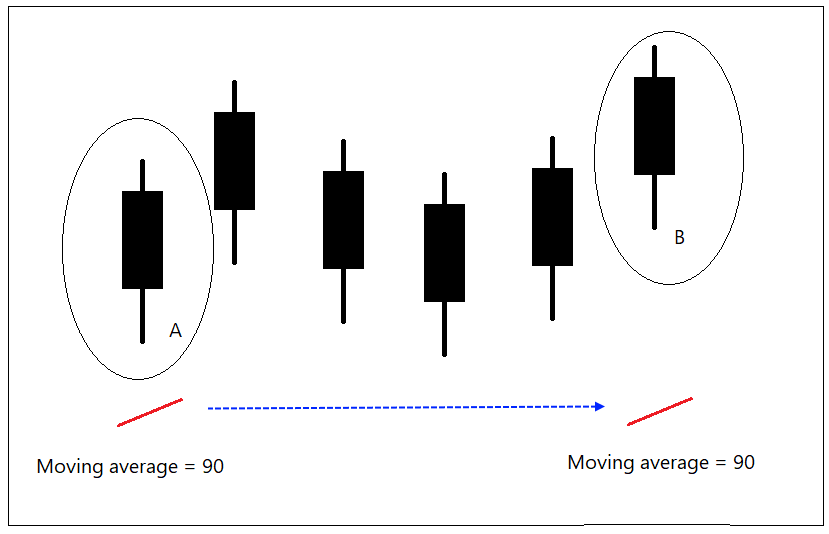
The indicator rises steadily if the trend is steady. If the trend is strong the indicator should accelerate, it should move faster and stop should get trailed aggressively.
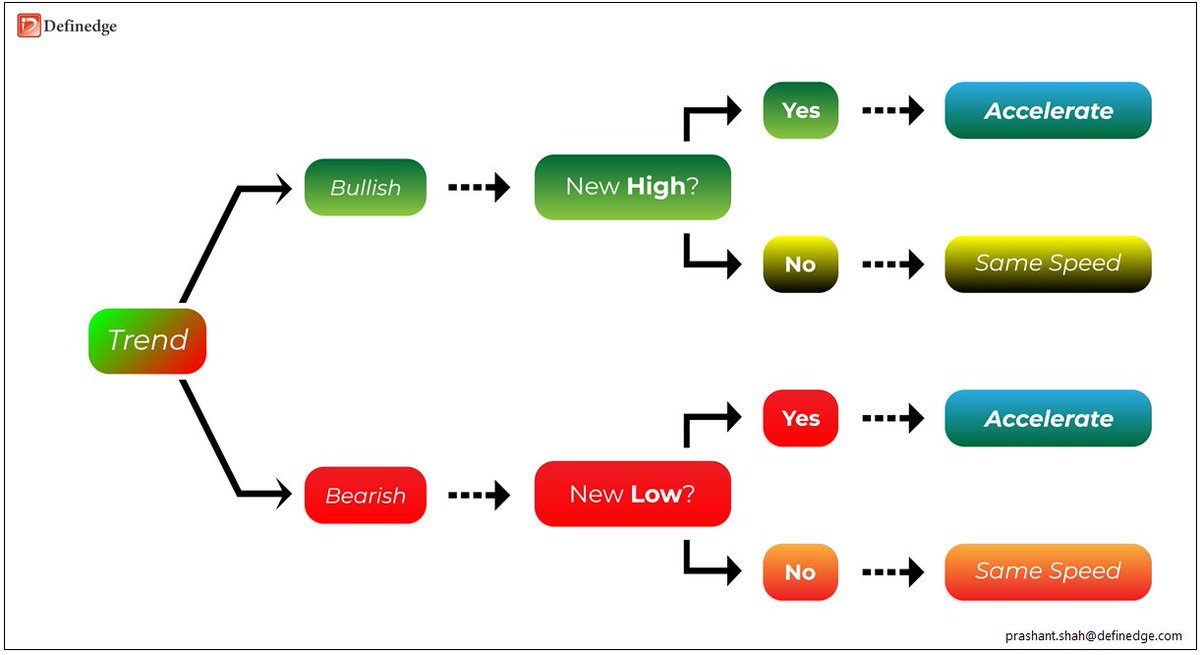
What is strong trend?
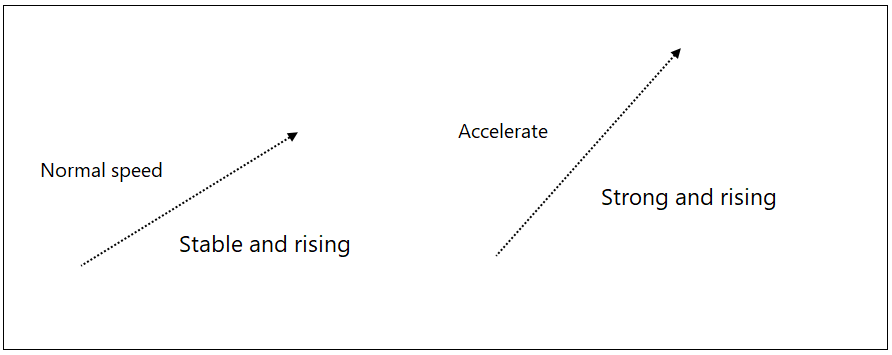
In a bullish trend if price makes a new high it is a strong bullish trend.
In a bearish trend, if price makes a new low it is a strong bearish trend.
Period?
Period for new high: since the indicator turned bullish
Period for new low: since the indicator turned bearish
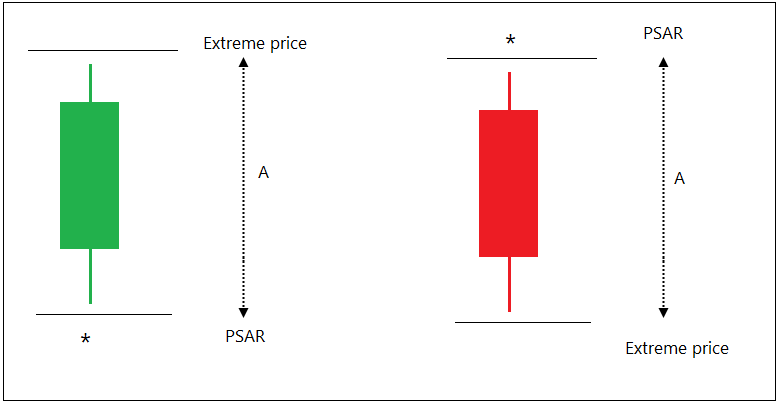
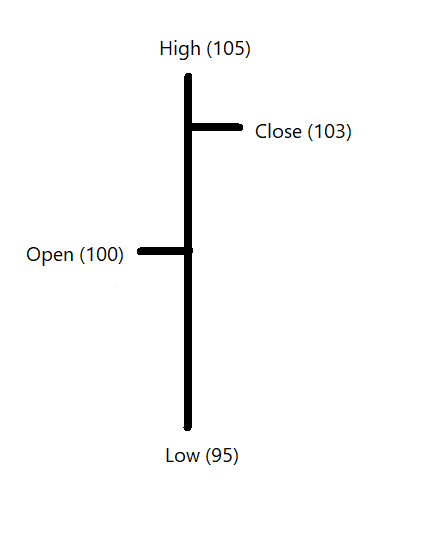
Calculation of PSAR: EP, AF and PSAR
Extreme Price (EP) is calculated on every candle.
‘High’ price in bullish market and ‘Low’ price in bearish market is called as Extreme Price (EP).
If new high is made -> EP = New High price
Else
EP = Prev High
If Bearish trend
If new low is made -> EP = New Low price
Else
EP = Prev Low
Period of new high or low is explained earlier.
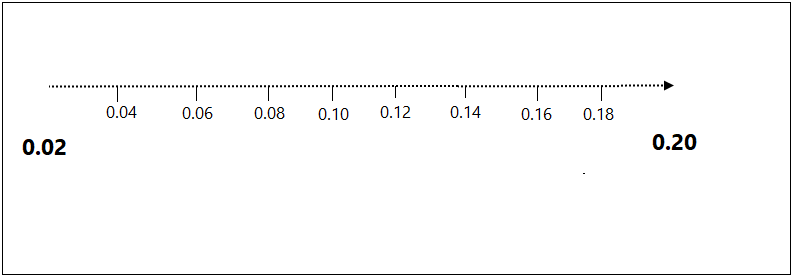
> Accelerate it by 0.02 if trend is steady.
> Add 0.02 to previous speed if trend is strong.
> Maximum acceleration will be 0.20.
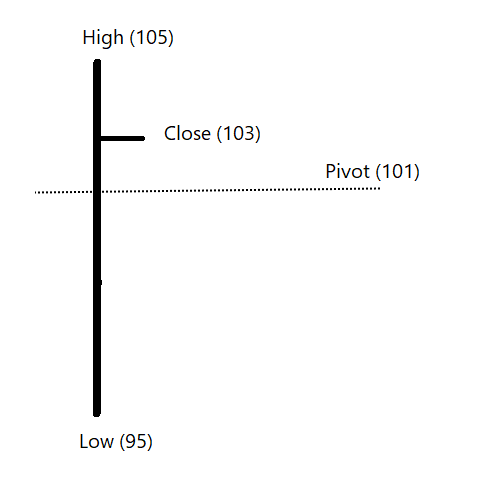
Multiply Acceleration factor by A and add it to the previous stop-loss, you get new PSAR indicator reading.
PSAR = A x AF + Previous PSAR reading
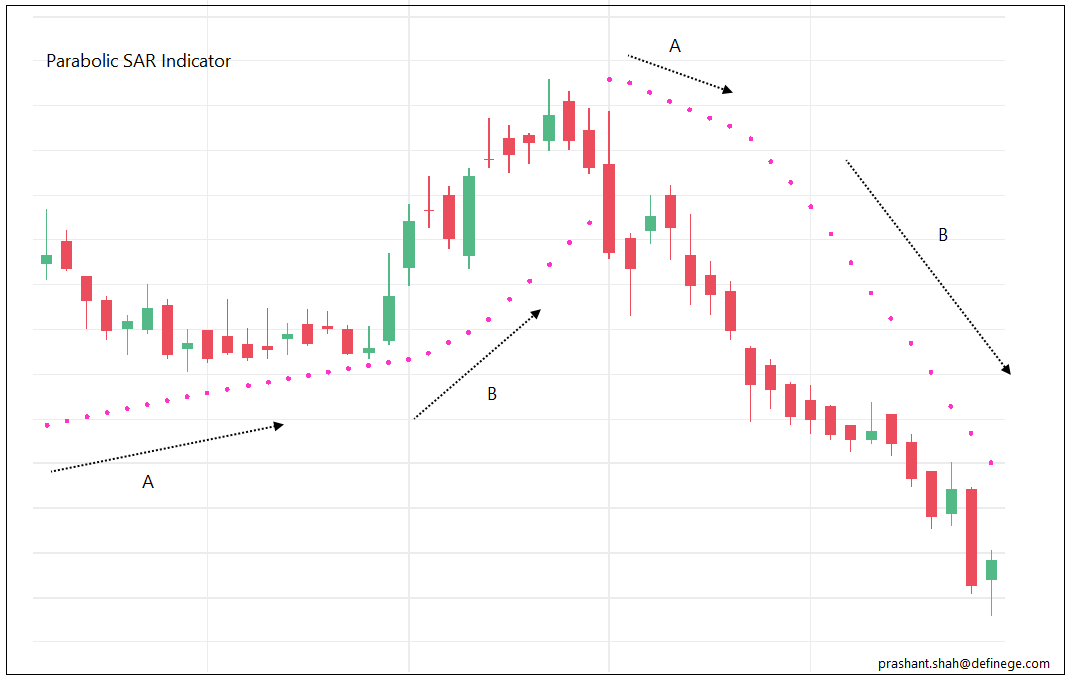
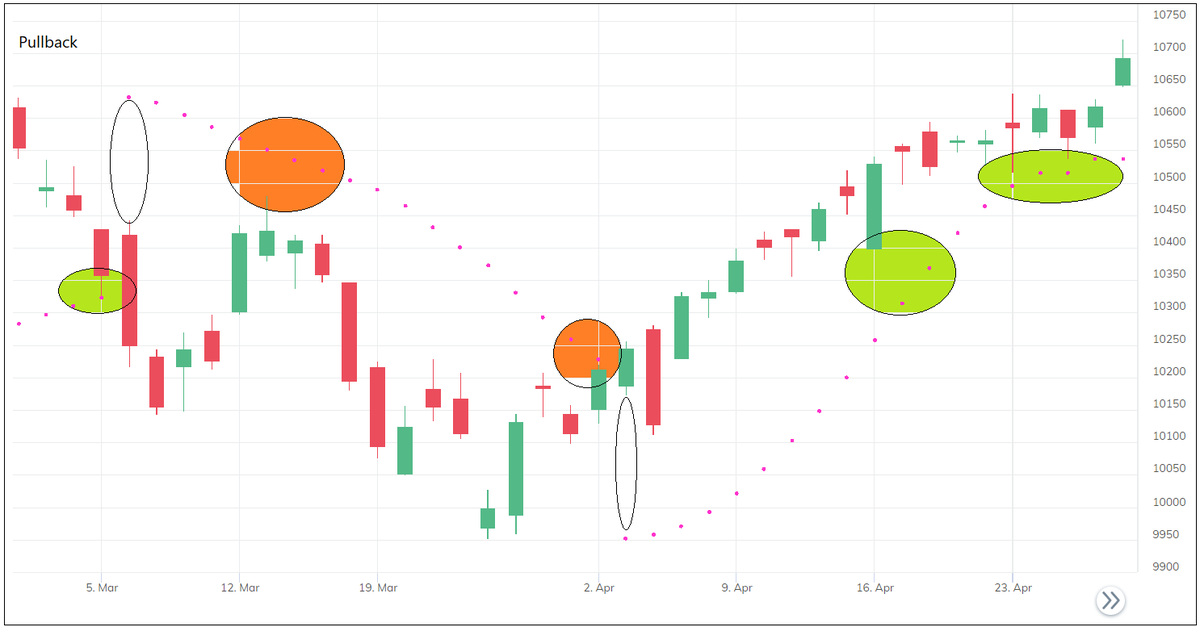
Phase A is when indicator moving at a steady speed. Phase B is when trend is strong (New high in bull market, new low in bear market) hence, PSAR is accelerating with a greater speed (0.02 being added) during B.
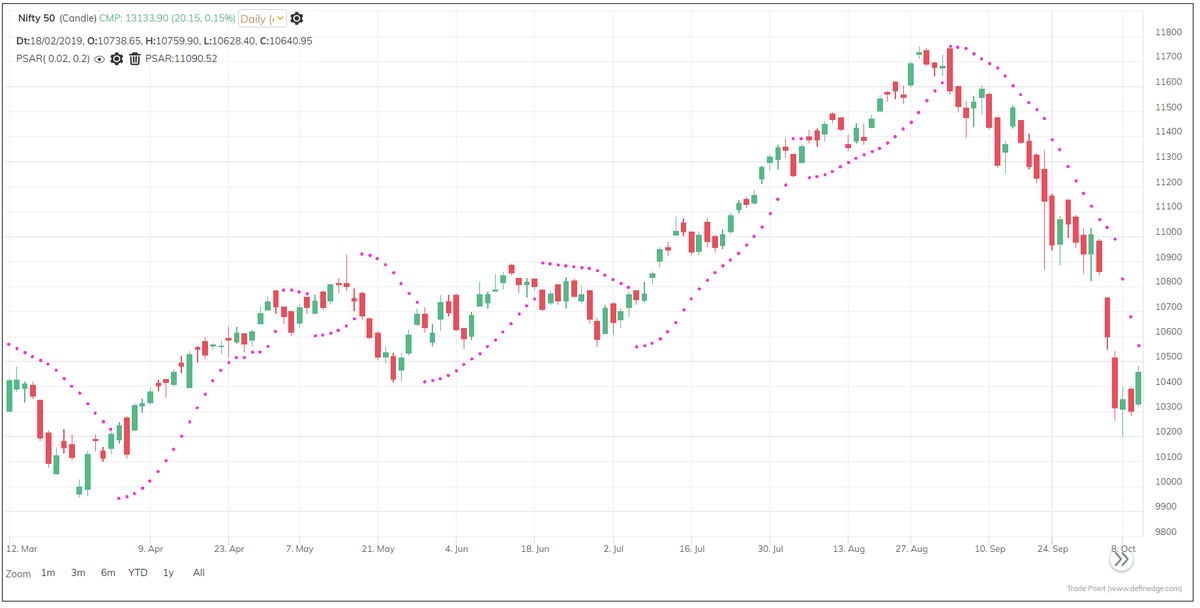
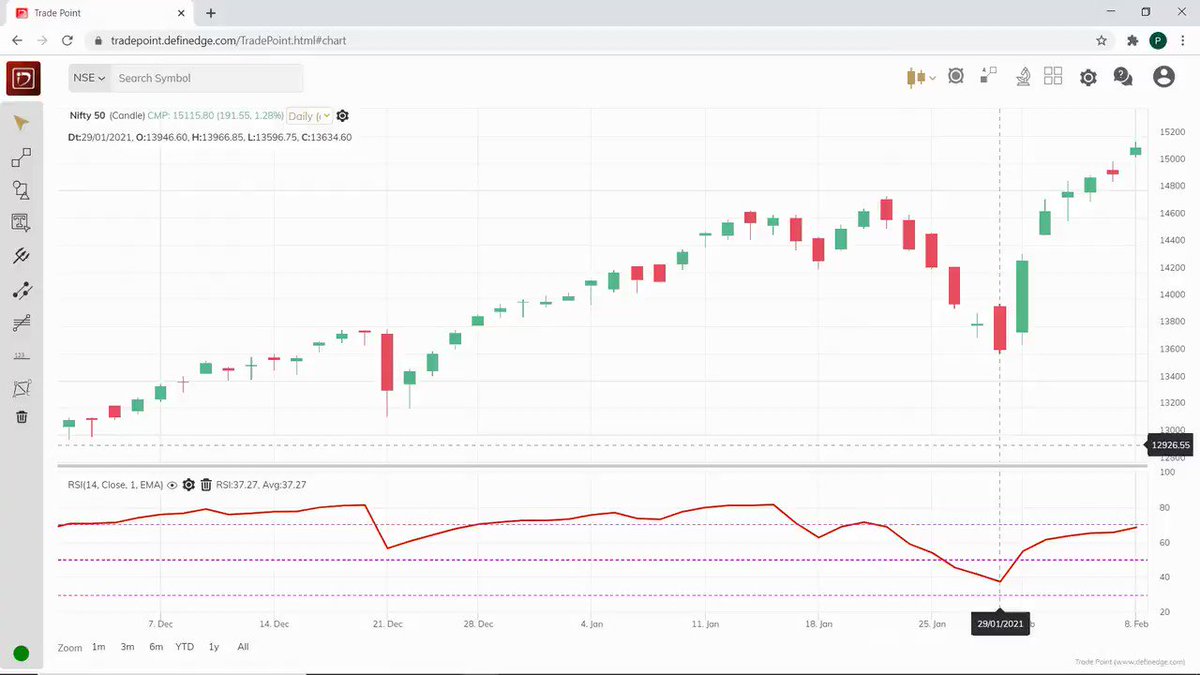
Trend is bullish when price is above the PSAR, it is bearish when price is below PSAR. You can use it as a trend filtration method.
Indicator accelerates during strong trends. Hence, rising PSAR and Falling PSAR are also important.
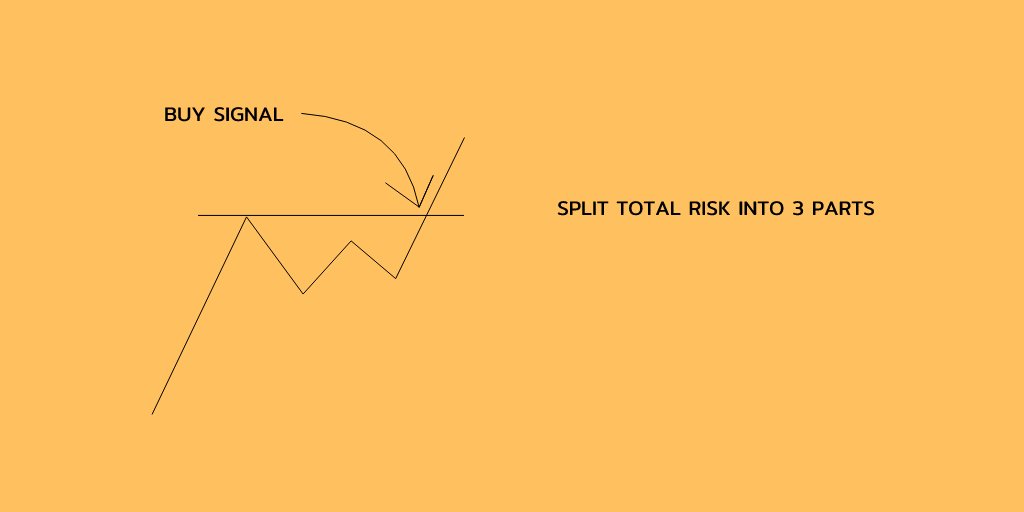
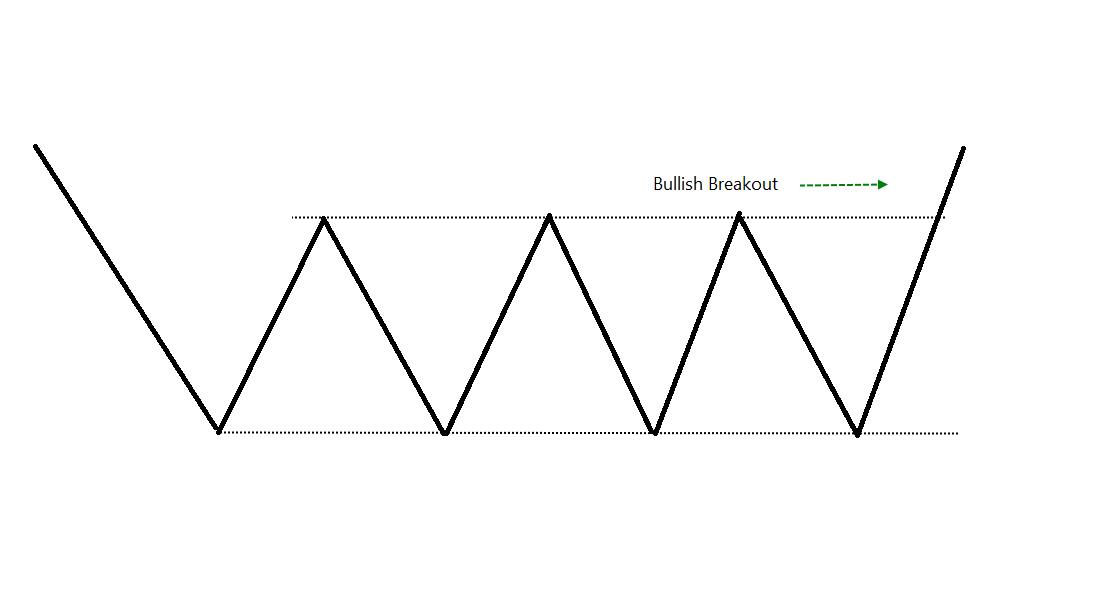
When trend changes, the length of the stop-loss depends on the previous high or low. Avoid the signal if initial stop-loss is not affordable. Wait for the pullback pattern that provides better risk-reward trade
It can be used alone or combined with other studies to design the system.
Below are some Important things about PSAR indictor:
• Unlike many other indicators, you do not have to define the look-back period, define the acceleration factor
• It does not use method of averaging
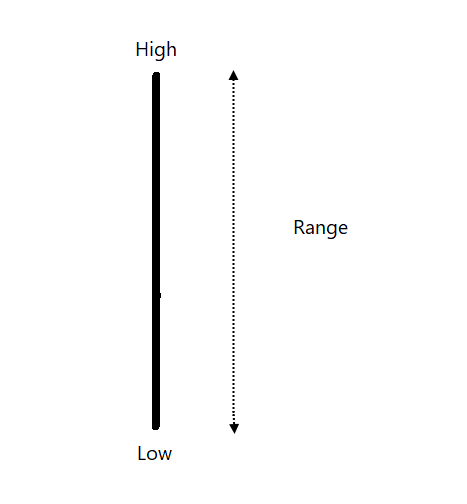
• It uses high, low prices to determine the trend and stop-loss level
• Indicator accelerates if trend is strong
More from Prashant Shah

More from Trading

DJ @ITRADE191 multiple chart analysis for INTRADAY TRADING.
1. Core setup
2. Pivot points trades
3. PDH/PDL trades
4. Open interest addictions combined with rejections on charts.
5. Website to confirm bias
Very quick read.
Share if you liked for the benefit of everyone.
•Main setup of @ITRADE191
He used this setup daily for all trades.
1. EMA crossover 10/20
2. Supertrend 10/3
3. Vwap
4. RSI >
•Volume always greater than
•Candle Rejecting from
•Pivot settings
1. Core setup
2. Pivot points trades
3. PDH/PDL trades
4. Open interest addictions combined with rejections on charts.
5. Website to confirm bias
Very quick read.
Share if you liked for the benefit of everyone.
•Main setup of @ITRADE191
He used this setup daily for all trades.
1. EMA crossover 10/20
2. Supertrend 10/3
3. Vwap
4. RSI >
@MiteshFan @Mitesh_Engr @Abhishekkar_ MY TRADING SETUP .... I've been using it for a long time .. result good try it \U0001f607 pic.twitter.com/XThUD0ftbl
— itrade(DJ) (@ITRADE191) June 13, 2020
•Volume always greater than
Volume Should always be above 20 pic.twitter.com/CPgxLgpPKF
— itrade(DJ) (@ITRADE191) June 13, 2020
•Candle Rejecting from
— itrade(DJ) (@ITRADE191) August 25, 2020
•Pivot settings
— itrade(DJ) (@ITRADE191) October 20, 2020