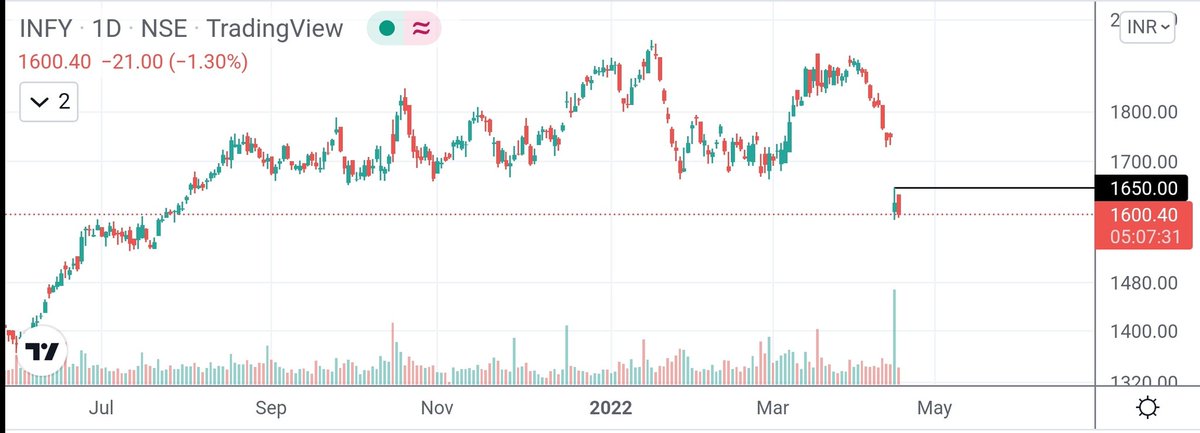
2) July to Aug: IT consolidating, metals outperforming.
3) Aug to Oct: IT moving up, metals under retracement.
(2/4)

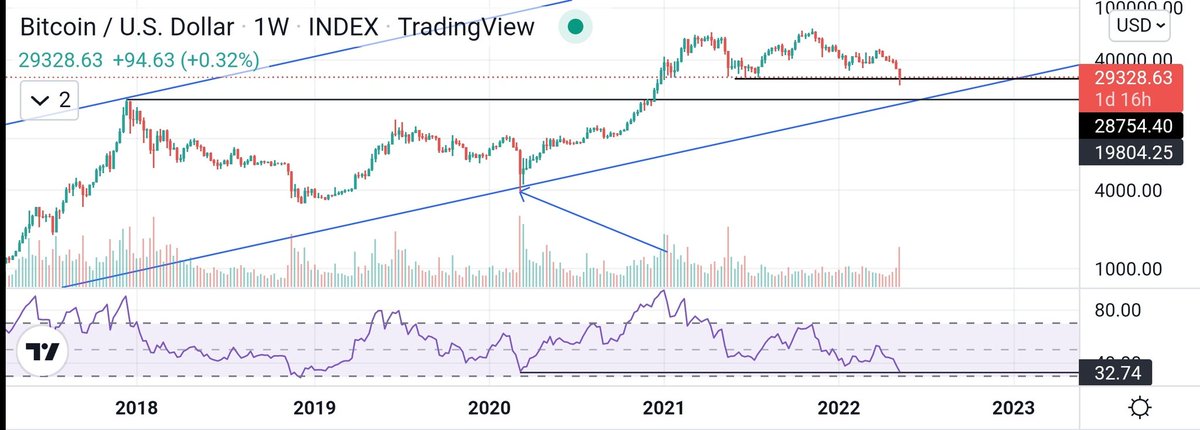
#BITCOIN
— Mayank Narula (@Mayank_Narula1) March 5, 2022
Pending RSI divergence on monthly chart which requires a dip under 13805 to get resolved.
But monthly RSI divergences can go on for years before the resolution.
Best case scenario will be panic dump over next few months. pic.twitter.com/hi67hMg9sZ
Compelled to take down notes from this very interesting talk by @SamitVartak and share with the Investing community. Was introduced to this gentleman by @ishmohit1 - Thanks !!https://t.co/bCfjfNBWO1
— Mouzam (@mmali09) July 18, 2021
Highly recommended to watch it.
\u267b\ufe0fRetweet to if you find my notes useful https://t.co/3zZ9qCf90z pic.twitter.com/LGjoJDaJsT
The stock exploded & went up as much as 63% from my price.
— Manas Arora (@iManasArora) June 22, 2020
Closed my position entirely today!#BroTip pic.twitter.com/CRbQh3kvMM
What an extended (away from averages) move looks like!!
— Manas Arora (@iManasArora) June 24, 2020
If you don't learn to sell into strength, be ready to give away the majority of your gains.#GLENMARK pic.twitter.com/5DsRTUaGO2
#HIKAL
— Manas Arora (@iManasArora) July 2, 2021
Closed remaining at 560
Reason: It is 40+% from 10wma. Super extended
Total revenue: 11R * 0.25 (size) = 2.75% on portfolio
Trade closed pic.twitter.com/YDDvhz8swT
When you see 15 green weeks in a row, that's the end of the move. *Extended*
— Manas Arora (@iManasArora) August 26, 2019
Simple price action analysis.#Seamecltd https://t.co/gR9xzgeb9K