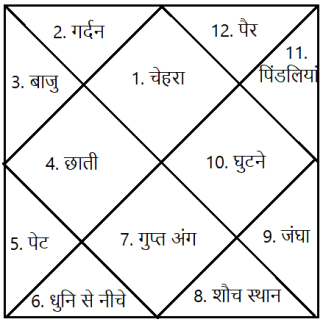
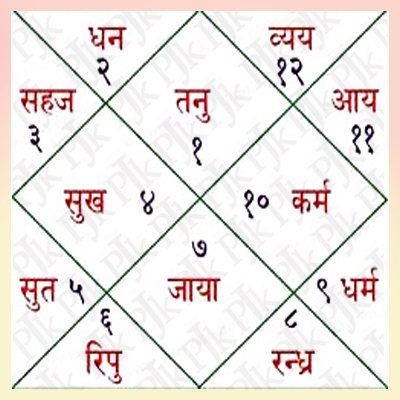
कुंडली में 12 भाव होते हैं। कैसे ज्योतिष द्वारा रोग के आंकलन करते समय कुंडली के विभिन्न भावों से गणना करते हैं आज इस पर चर्चा करेंगे।
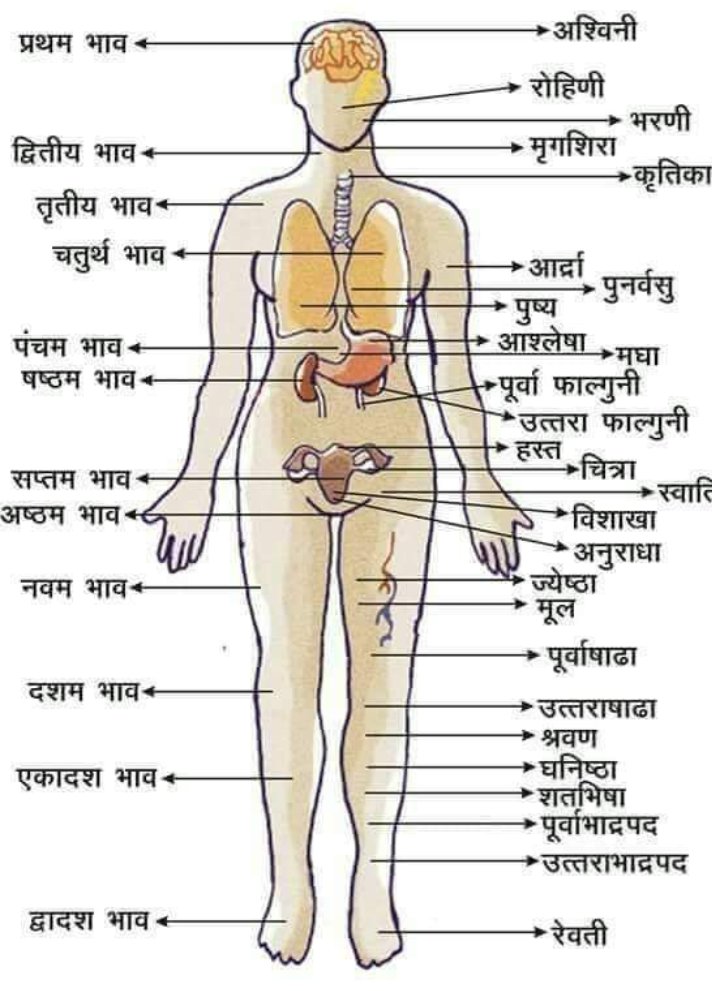
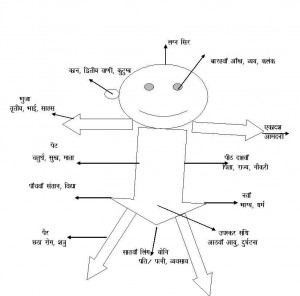
कुण्डली को कालपुरुष की संज्ञा देकर इसमें शरीर के अंगों को स्थापित कर उनसे रोग, रोगेश, रोग को बढ़ाने घटाने वाले ग्रह
रोग की स्थिति में उत्प्रेरक का कार्य करने वाले ग्रह, आयुर्वेदिक/ऐलोपैथी/होमियोपैथी में से कौन कारगर होगा इसका आँकलन, रक्त विकार, रक्त और आपरेशन की स्थिति, कौन सा आंतरिक या बाहरी अंग प्रभावित होगा इत्यादि गणना करने में कुंडली का प्रयोग किया जाता है।
मेडिकल ज्योतिष में आज के समय में Dr. K. S. Charak का नाम निर्विवाद रूप से प्रथम स्थान रखता है। उनकी लिखी कई पुस्तकें आज इस क्षेत्र में नए ज्योतिषों का मार्गदर्शन कर रही हैं।
प्रथम भाव -
इस भाव से हम व्यक्ति की रोगप्रतिरोधक क्षमता, सिर, मष्तिस्क का विचार करते हैं।
द्वितीय भाव-
दाहिना नेत्र, मुख, वाणी, नाक, गर्दन व गले के ऊपरी भाग का विचार होता है।
तृतीय भाव-
अस्थि, गला,कान, हाथ, कंधे व छाती के आंतरिक अंगों का शुरुआती भाग इत्यादि।
चतुर्थ भाव- छाती व इसके आंतरिक अंग, जातक की मानसिक स्थिति/प्रकृति, स्तन आदि की गणना की जाती है
पंचम भाव-
जातक की बुद्धि व उसकी तीव्रता,पीठ, पसलियां,पेट, हृदय की स्थिति आंकलन में प्रयोग होता है।
षष्ठ भाव-
रोग भाव कहा जाता है। कुंडली मे इसके तत्कालिक भाव स्वामी, कालपुरुष कुंडली के स्वामी, दृष्टि संबंध, रोगेश की स्थिति, रोगेश के नक्षत्र औऱ रोगेश व भाव की डिग्री इत्यादि।