Bharat: Advancement of earth’s earliest civilization
Glorious Vedic Architecture and Temple
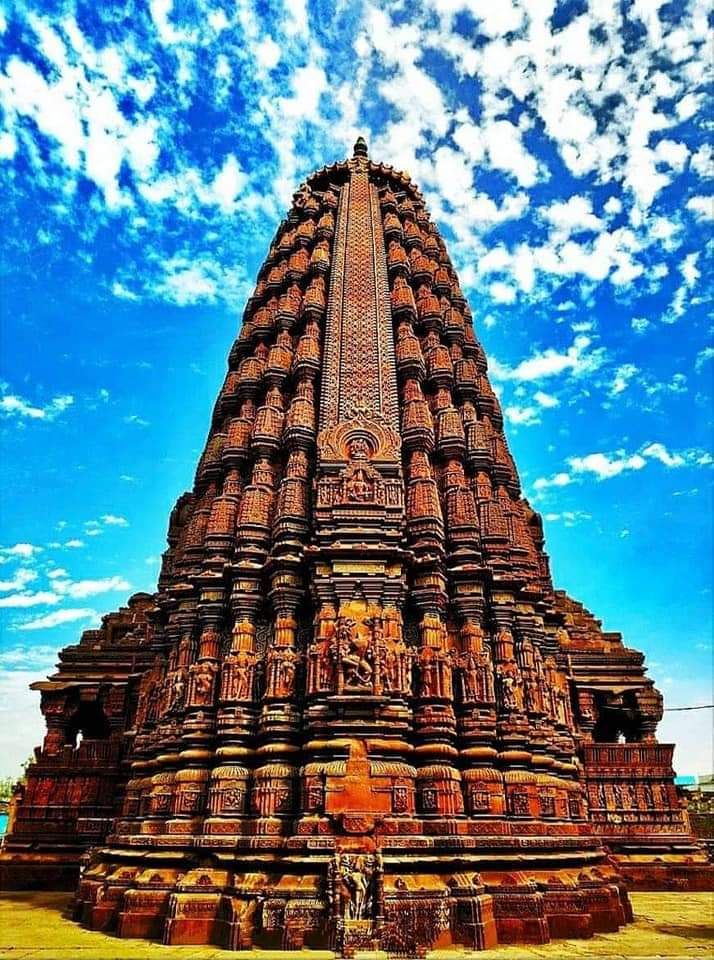
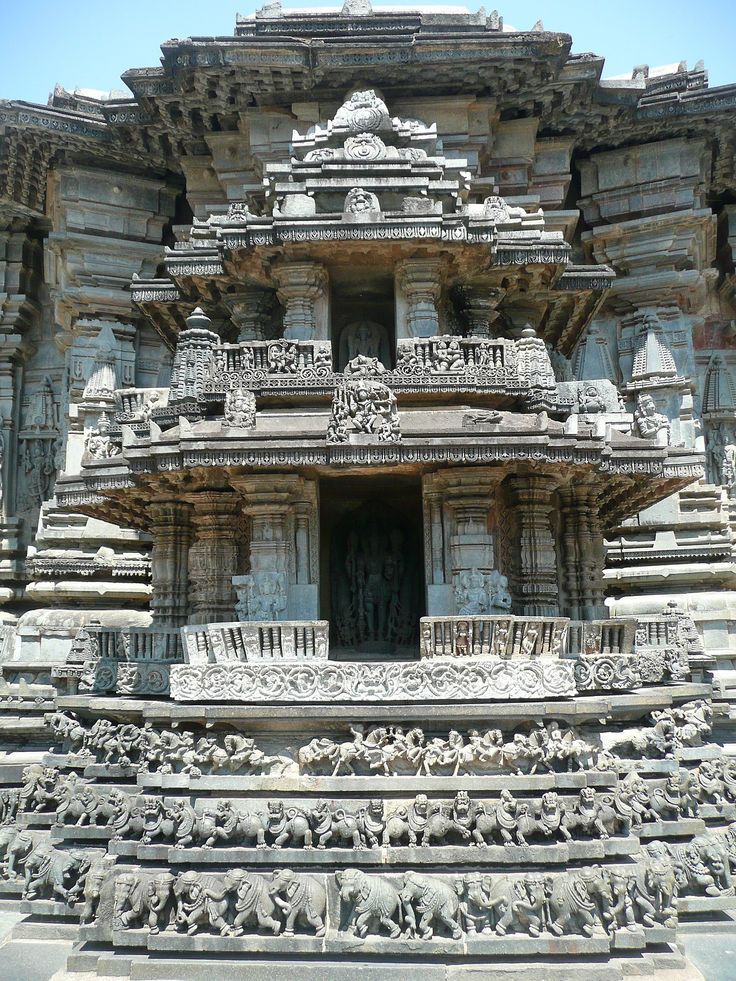
Architecture in India was an extremely rich form of expression and highly developed science, with a deep heritage of spirituality in it. #FreeHinduTemple
The centre of all architectural development was the temple and temple or Mandir was the earthly home of God, and like the launching pad for the devotee’s consciousness to soar toward the Divine and the spiritual world.
The murti or deity of the Divine would be placed in the temple sanctum, around which all temple activity would revolve.
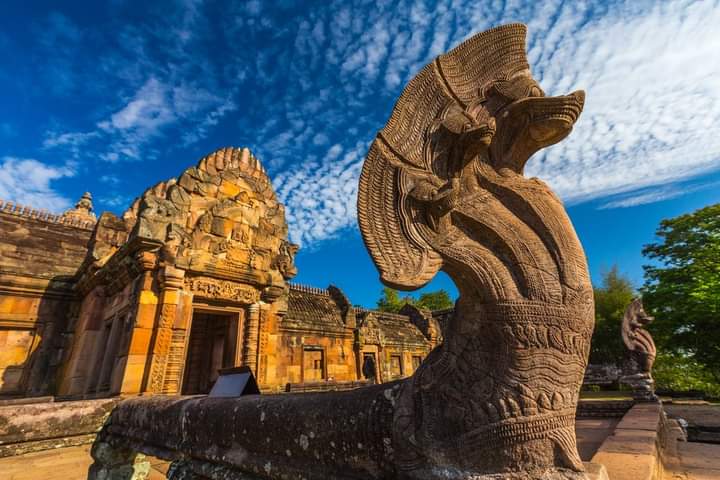
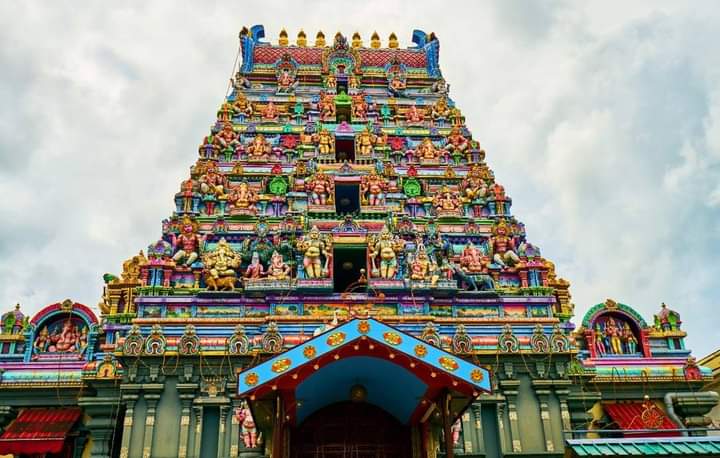
Such buildings were often elaborately decorated with stone, wood, plaster, etc. and carved or cut to depict the stories from the Puranas or other sacred texts
Temples were always the centre of religious, social and educational activities, practically more so in
ancient times than today.
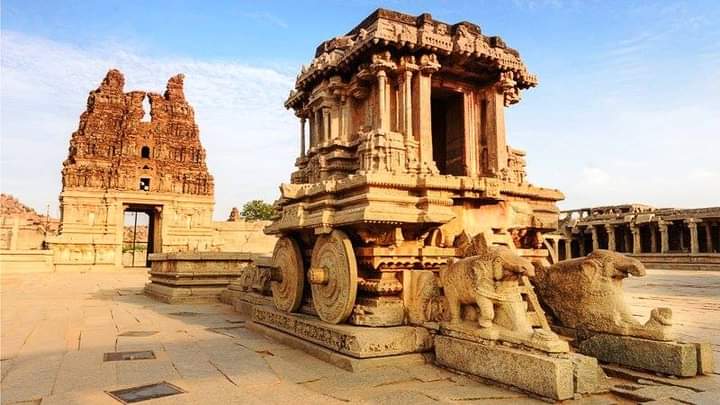
During a span of more than two thousand years, various dynasties were known for constructing glorious temples,
some of which include the Mauryan, Ashoka, Gupta, Satavahana, Chedi, Chandella, Chalukya, Solanki, Pallava, Shola, Hoysala, Vijayanagar, and others.
Many of these temples remain beautiful architectural wonders today.