6 Free Tools and Platforms Every Day-Trader Should Be Using!
Why pay, when they are available for FREE?
More from Indrazith Shantharaj


More from Stockslearnings

1/n
Dear @chartmojo
Out of curiosity, just gone through your timeline and prepared a data of your shared tweets in OCT'2020;
You will not believe the following numbers:
Charts shared = 29 (2 excluded due to splits)
Period = 8-oct to 30-oct'20
..
2/n
If min.10k invested on your each design, then
Amount invested in Oct'20 = 2.91 lacs
Present investment value = 4.72 lacs
Maximum drawdown = 9%
ROI = 62% in 200 days
Annualized ROI = 147%
**You ROCK brother**
...
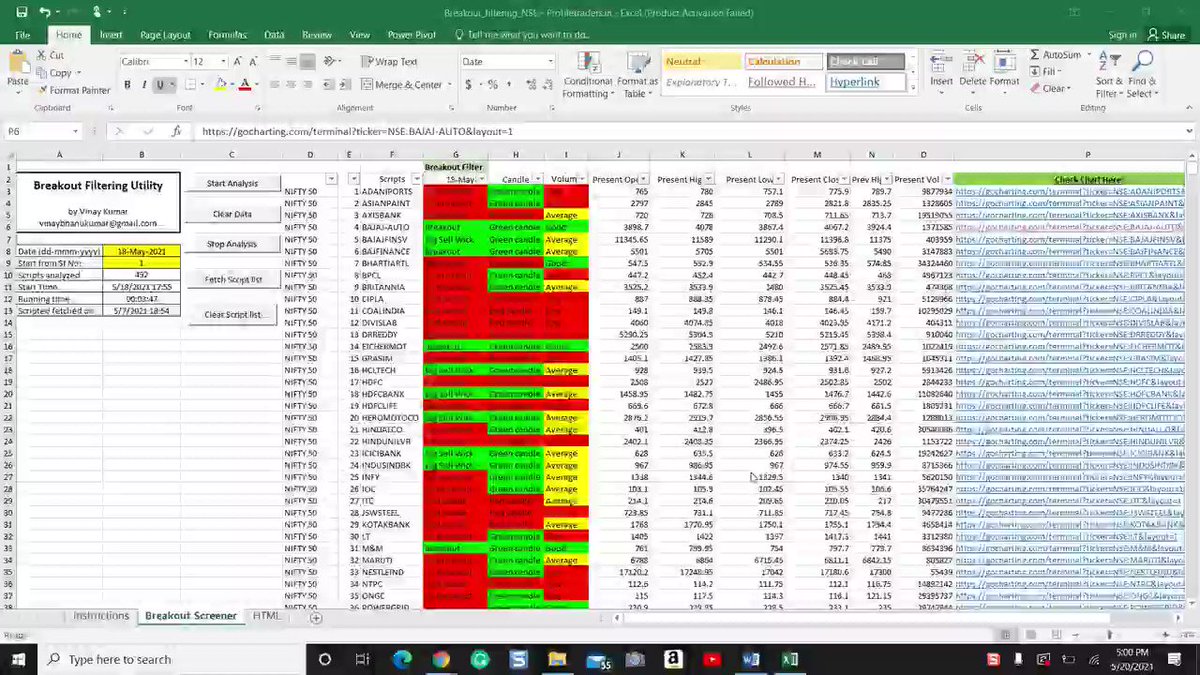
I've prepared a sheet for all your Oct'20 tweets; It was so much learning on the charts as well as on the data-part; Please keep on the good work.
Sheet link:
https://t.co/8BJtMsOkBD
With regards,
Deepak
Dear @chartmojo
Out of curiosity, just gone through your timeline and prepared a data of your shared tweets in OCT'2020;
You will not believe the following numbers:
Charts shared = 29 (2 excluded due to splits)
Period = 8-oct to 30-oct'20
..
2/n
If min.10k invested on your each design, then
Amount invested in Oct'20 = 2.91 lacs
Present investment value = 4.72 lacs
Maximum drawdown = 9%
ROI = 62% in 200 days
Annualized ROI = 147%
**You ROCK brother**
...
I've prepared a sheet for all your Oct'20 tweets; It was so much learning on the charts as well as on the data-part; Please keep on the good work.
Sheet link:
https://t.co/8BJtMsOkBD
With regards,
Deepak


Should you add more in Equity or redeem right now?
A thread 🧵to guide retail on why & what should they do at these historic market highs.
Do ‘re-tweet’ and help us educate more retail investors (1/n)
#investing #StockMarket
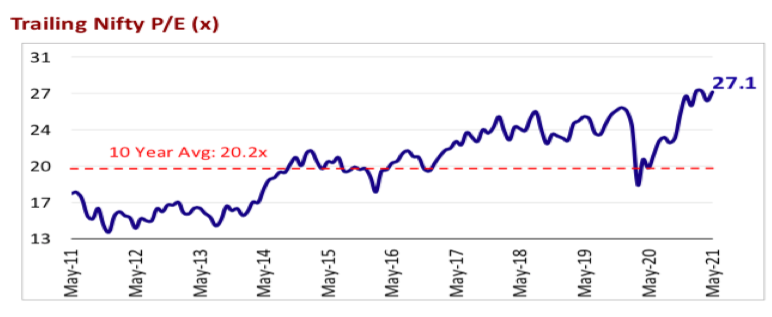
Some investors feel that markets are trading at a PE of 27 vs 10 years historical average of 20 and a market-cap to GDP of 105 vs historical average of 79 and hence markets look expensive (2/n)
But, in such crazy liquidity driven markets, prices can move much ahead of the fundamentals & suddenly we start hearing commentaries of how the market is pricing in the earnings of FY 22 & 23 to justify the rally
If you r new to fundamentals, 👇 can help
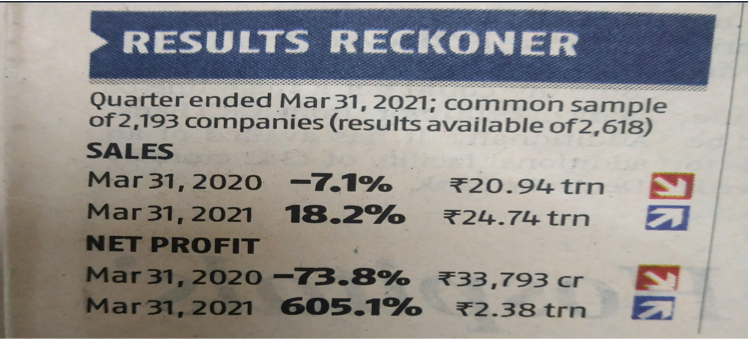
Results for Q4 have come out very well but that is also because of the lower base effect of the last year.
Over the last many years, markets have corrected 10-15% each calendar year. Can it happen this year as well? Can very much and that can be a great entry point. Why? (4/n)
There are a lot of over hangs in the near term,
-Crude going up
-$ index moving up
-Inflation moving up
-COVID uncertainties
All of the above are –ve for markets & liquidity on the other side driving markets up, its impossible to judge the near term movement of the markets (5/n)
A thread 🧵to guide retail on why & what should they do at these historic market highs.
Do ‘re-tweet’ and help us educate more retail investors (1/n)
#investing #StockMarket
Some investors feel that markets are trading at a PE of 27 vs 10 years historical average of 20 and a market-cap to GDP of 105 vs historical average of 79 and hence markets look expensive (2/n)
But, in such crazy liquidity driven markets, prices can move much ahead of the fundamentals & suddenly we start hearing commentaries of how the market is pricing in the earnings of FY 22 & 23 to justify the rally
If you r new to fundamentals, 👇 can help
Market PE at 40 and yet the market is not falling, why? Getting asked this question multiple times. Here's a thread covering \u2018very basic\u2019 premier on valuation for my retail investor friends.
— Kirtan A Shah (@KirtanShahCFP) January 14, 2021
Do hit the \u2018re-tweet\u2019 and help us educate more investors (1/n) pic.twitter.com/8oCkBmmOXY
Results for Q4 have come out very well but that is also because of the lower base effect of the last year.
Over the last many years, markets have corrected 10-15% each calendar year. Can it happen this year as well? Can very much and that can be a great entry point. Why? (4/n)
There are a lot of over hangs in the near term,
-Crude going up
-$ index moving up
-Inflation moving up
-COVID uncertainties
All of the above are –ve for markets & liquidity on the other side driving markets up, its impossible to judge the near term movement of the markets (5/n)


You May Also Like


Oh my Goodness!!!
I might have a panic attack due to excitement!!
Read this thread to the end...I just had an epiphany and my mind is blown. Actually, more than blown. More like OBLITERATED! This is the thing! This is the thing that will blow the entire thing out of the water!
Has this man been concealing his true identity?
Is this man a supposed 'dead' Seal Team Six soldier?
Witness protection to be kept safe until the right moment when all will be revealed?!
Who ELSE is alive that may have faked their death/gone into witness protection?

Were "golden tickets" inside the envelopes??

Are these "golden tickets" going to lead to their ultimate undoing?
Review crumbs on the board re: 'gold'.

#SEALTeam6 Trump re-tweeted this.

I might have a panic attack due to excitement!!
Read this thread to the end...I just had an epiphany and my mind is blown. Actually, more than blown. More like OBLITERATED! This is the thing! This is the thing that will blow the entire thing out of the water!
Tik Tok pic.twitter.com/8X3oMxvncP
— Scotty Mar10 (@Allenma15086871) December 29, 2020
Has this man been concealing his true identity?
Is this man a supposed 'dead' Seal Team Six soldier?
Witness protection to be kept safe until the right moment when all will be revealed?!
Who ELSE is alive that may have faked their death/gone into witness protection?
Were "golden tickets" inside the envelopes??
Are these "golden tickets" going to lead to their ultimate undoing?
Review crumbs on the board re: 'gold'.
#SEALTeam6 Trump re-tweeted this.