
Say, Raju is a businessman. Now, like every businessman, Raju is ambitious and curious to know his profit. Hence, he keeps his accounts to calculate his profit.
A super simple thread to help everyone understand the concept of 'Fiscal Deficit' and what happens when government spends more than its receipts. 👇🧵
#fiscaldeficit #economics #financialliteracy
Say, Raju is a businessman. Now, like every businessman, Raju is ambitious and curious to know his profit. Hence, he keeps his accounts to calculate his profit.
👉The Government Receipt (excluding borrowings) > The Government Expenditure, then the difference is called as ‘Fiscal Surplus’.
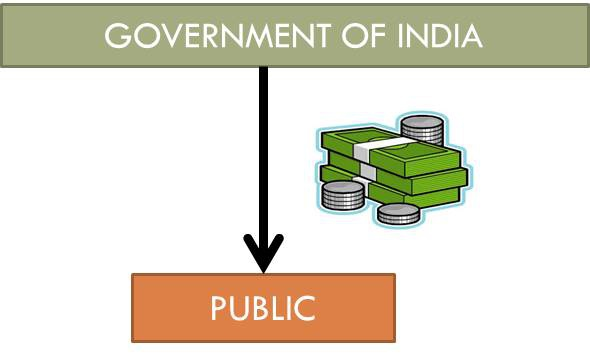
👉The Government Receipts (excluding borrowings) < The Government Expenditure, then the difference is called as ‘Fiscal Deficit’.
Many people see this in a bad light. But, it is not as bad as it looks. Why so? Lets find out!
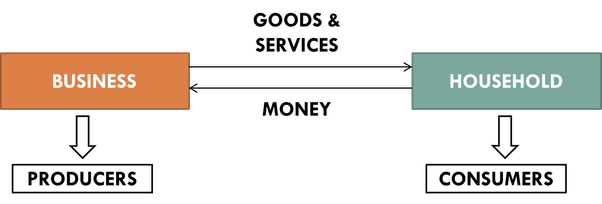
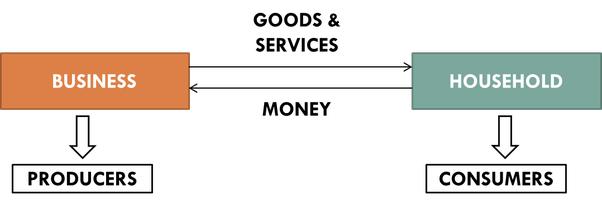
More credit would mean businesses would invest more money and there will be increase in employment, output and income.
https://t.co/hf9ucOopdY
A super simple thread to help everyone understand Gross Domestic Product (GDP), Real GDP and Nominal GDP.
— swapnilkabra (@caswapnilkabra) December 25, 2020
Do Bookmark for further use. \U0001f9f5\U0001f447#GDP #Economy #financialliteracy
Let us spread financial literacy!
More from swapnilkabra


More from Government

🧵⬇️1. Fb is LifeLog, LifeLog is Darpa, and DARPA is a Enterprise Run by CIA... Well... Past President... Big Tech, Big Pharma, MSM, HOLLYWOOD, DC...
Past Presidents....Zuckerberg, Gates...
All C_A... the Family business.... The company...
2. Past Presidents....Zuckerberg, Gates...
All C_A... the Family business.... The company...The Farm.... all C_A assets... most of them related by blood, business, or marriage...

3. "The individual is handicapped by coming face-to-face with a conspiracy so monstrous he cannot believe it exists. The American mind simply has not come to a realization of the evil which has been introduced into our midst." - J. Edgar Hoover

4. diff. names & faces.... Monsters that lurk in the Shadows. Swamp, Deep State, Establishment, Globalist Elite Cabal...
Shall we go back...How far back...

5. I know these monsters... it's when I try to explain them to others is when I run into a problem.This is why I'm better at retweeting and compiling. I never know where to start... Everytime I try to thread, i end up w/ a messy monstrous web.I'm better at helping others thread.

Past Presidents....Zuckerberg, Gates...
All C_A... the Family business.... The company...
BREAKING\u2014 \u201cThis \u2018SHADOW GOVERNMENT\u2019 had a huge hand in running the show on Nov. 3 and you may have not known it\u201d says attorney Phil Kine. @newsmax pic.twitter.com/8ypASTEA1Z
— White Rabbit News \u277c (@WhiteRabbitNN) December 17, 2020
2. Past Presidents....Zuckerberg, Gates...
All C_A... the Family business.... The company...The Farm.... all C_A assets... most of them related by blood, business, or marriage...
3. "The individual is handicapped by coming face-to-face with a conspiracy so monstrous he cannot believe it exists. The American mind simply has not come to a realization of the evil which has been introduced into our midst." - J. Edgar Hoover
4. diff. names & faces.... Monsters that lurk in the Shadows. Swamp, Deep State, Establishment, Globalist Elite Cabal...
Shall we go back...How far back...
5. I know these monsters... it's when I try to explain them to others is when I run into a problem.This is why I'm better at retweeting and compiling. I never know where to start... Everytime I try to thread, i end up w/ a messy monstrous web.I'm better at helping others thread.


The Government is making the same mistakes as it did in the first wave. Except with knowledge.
A thread.
The Government's strategy at the beginning of the pandemic was to 'cocoon' the vulnerable (e.g. those in care homes). This was a 'herd immunity' strategy. This interview is from
This strategy failed. It is impossible to 'cocoon' the vulnerable, as Covid is passed from younger people to older, more vulnerable people.
We can see this playing out through heatmaps. e.g. these heatmaps from the second
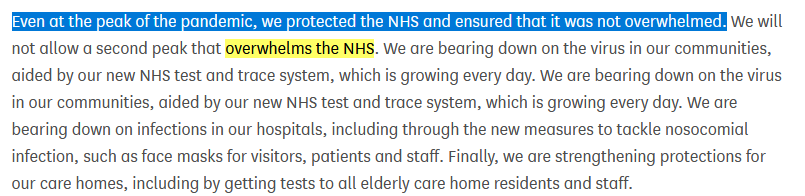
The Government then decided to change its strategy to 'preventing a second wave that overwhelms the NHS'. This was announced on 8 June in Parliament.
This is not the same as 'preventing a second wave'.
https://t.co/DPWiJbCKRm
The Academy of Medical Scientists published a report on 14 July 'Preparing for a Challenging Winter' commissioned by the Chief Scientific Adviser that set out what needed to be done in order to prevent a catastrophe over the winter
A thread.
The Government's strategy at the beginning of the pandemic was to 'cocoon' the vulnerable (e.g. those in care homes). This was a 'herd immunity' strategy. This interview is from
Government #coronavirus science advisor Dr David Halpern tells me of plans to \u2018cocoon\u2019 vulnerable groups. pic.twitter.com/dhECJNbmnI
— Mark Easton (@BBCMarkEaston) March 11, 2020
This strategy failed. It is impossible to 'cocoon' the vulnerable, as Covid is passed from younger people to older, more vulnerable people.
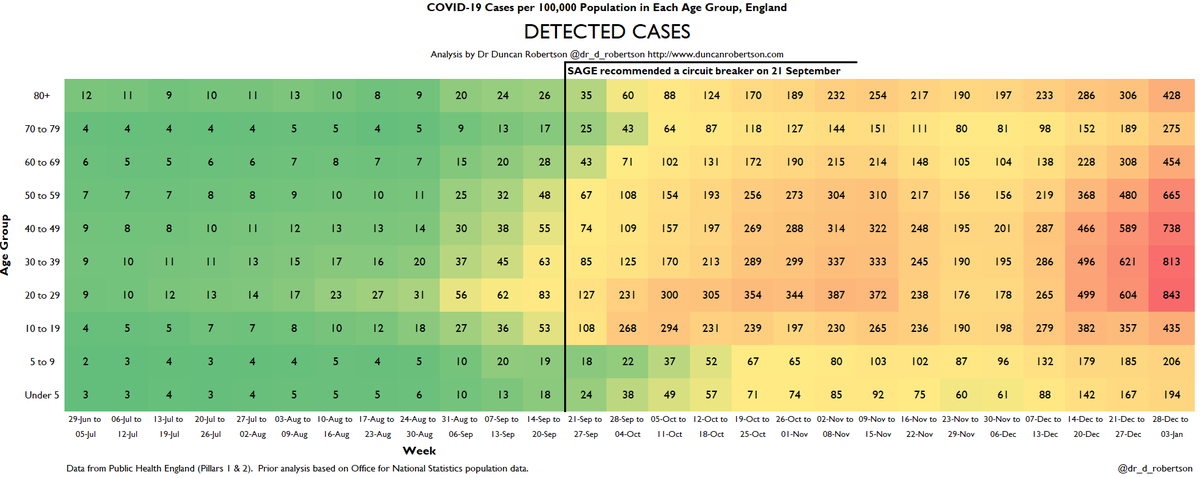
We can see this playing out through heatmaps. e.g. these heatmaps from the second
Here are the heatmaps for Covid detected cases, positivity, hospitalizations, and ICU admissions. This is for the week to 3 January 2021.
— Dr Duncan Robertson (@Dr_D_Robertson) January 7, 2021
I have marked a line on 21 September, when SAGE recommended a circuit breaker, so you can see how the situation has deteriorated since then. pic.twitter.com/SEEVgUVK4j
The Government then decided to change its strategy to 'preventing a second wave that overwhelms the NHS'. This was announced on 8 June in Parliament.
This is not the same as 'preventing a second wave'.
https://t.co/DPWiJbCKRm
The Academy of Medical Scientists published a report on 14 July 'Preparing for a Challenging Winter' commissioned by the Chief Scientific Adviser that set out what needed to be done in order to prevent a catastrophe over the winter
One thing civil servants learn is to write things down. Here is @acadmedsci's 14 July report commissioned by @uksciencechief. For the record.
— Dr Duncan Robertson (@Dr_D_Robertson) September 17, 2020

Which metric is a better predictor of the severity of the fall surge in US states?
1) Margin of Democrat victory in Nov 2020 election
or
2) % infected through Sep 1, 2020
Can you guess which plot is which?

The left plot is based on the % infected through Sep 1, 2020. You can see that there is very little correlation with the % infected since Sep 1.
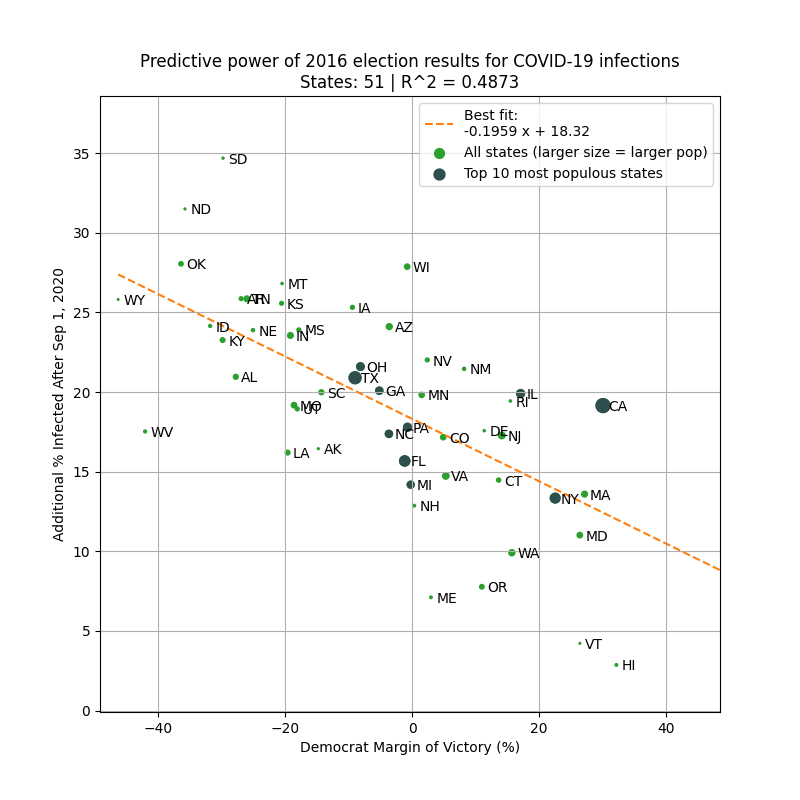
However, there is a *strong* correlation when using the margin of Biden's victory (right).
Infections % from https://t.co/WcXlfxv3Ah.

This is the strongest single variable I've seen in being able to explain the severity of this most recent wave in each state.
Not past infections / existing immunity, population density, racial makeup, latitude / weather / humidity, etc.
But political lean.
One can argue that states that lean Democrat are more likely to implement restrictions/mandates.
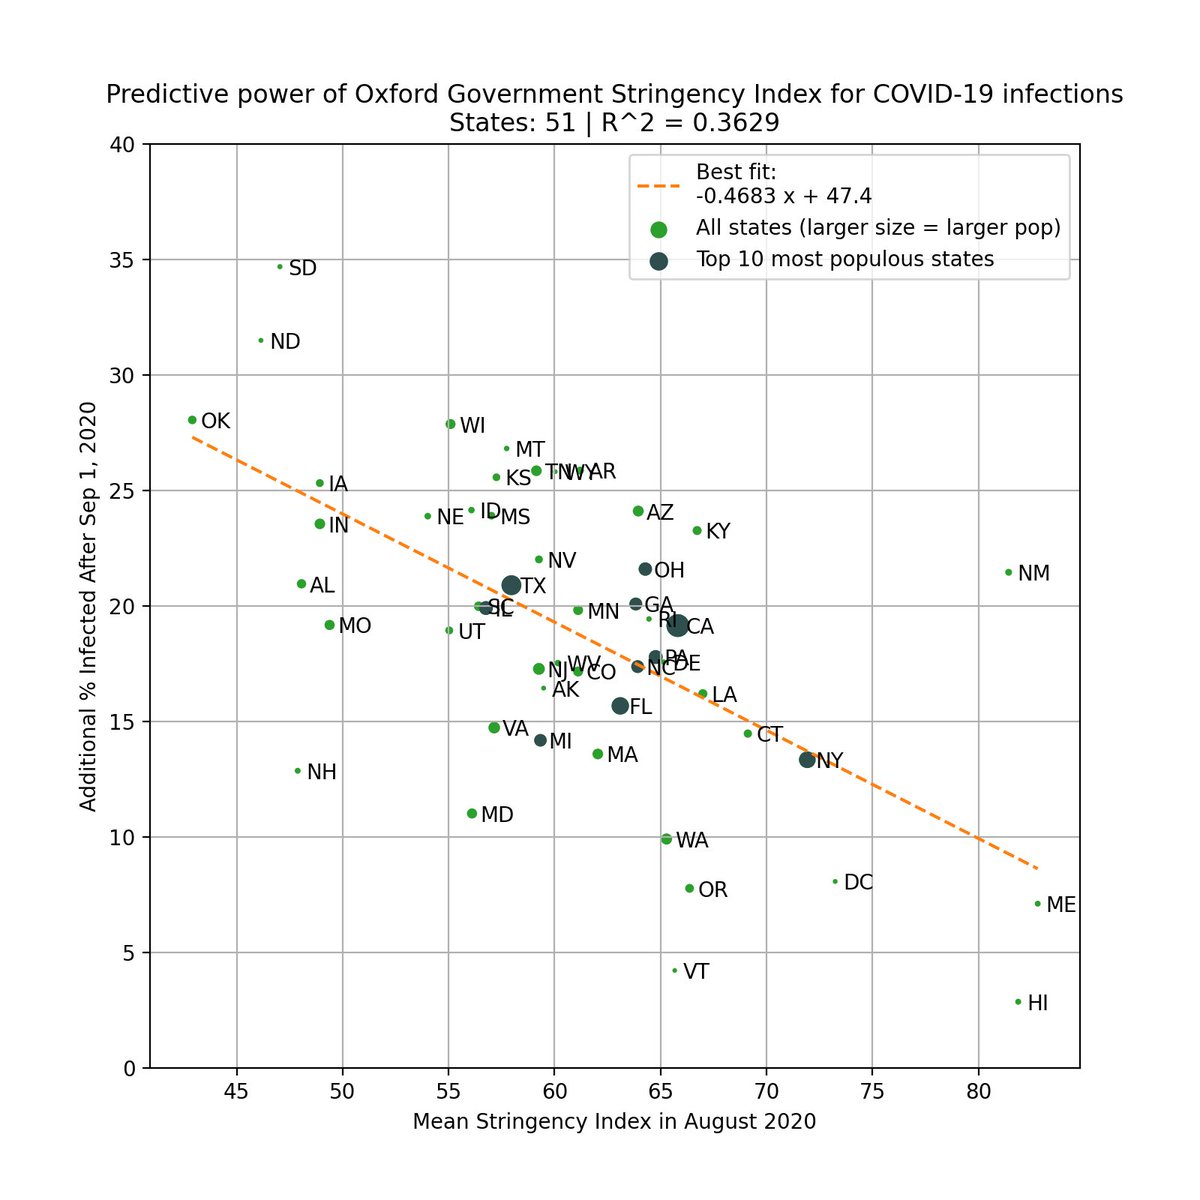
This is valid, so we test this by using the Government Stringency Index made by @UniofOxford.
We also see a correlation, but it's weaker (R^2=0.36 vs 0.50).
https://t.co/BxBBKwW6ta
To avoid look-ahead bias/confounding variables, here is the same analysis but using 2016 margin of victory as the predictor. Similar results.
This basically says that 2016 election results is a better predictor of the severity of the fall wave than intervention levels in 2020!
1) Margin of Democrat victory in Nov 2020 election
or
2) % infected through Sep 1, 2020
Can you guess which plot is which?
The left plot is based on the % infected through Sep 1, 2020. You can see that there is very little correlation with the % infected since Sep 1.
However, there is a *strong* correlation when using the margin of Biden's victory (right).
Infections % from https://t.co/WcXlfxv3Ah.
This is the strongest single variable I've seen in being able to explain the severity of this most recent wave in each state.
Not past infections / existing immunity, population density, racial makeup, latitude / weather / humidity, etc.
But political lean.
One can argue that states that lean Democrat are more likely to implement restrictions/mandates.
This is valid, so we test this by using the Government Stringency Index made by @UniofOxford.
We also see a correlation, but it's weaker (R^2=0.36 vs 0.50).
https://t.co/BxBBKwW6ta
To avoid look-ahead bias/confounding variables, here is the same analysis but using 2016 margin of victory as the predictor. Similar results.
This basically says that 2016 election results is a better predictor of the severity of the fall wave than intervention levels in 2020!

You May Also Like


A list of cool websites you might now know about
A thread 🧵
1) Learn Anything - Search tools for knowledge discovery that helps you understand any topic through the most efficient
2) Grad Speeches - Discover the best commencement speeches.
This website is made by me
3) What does the Internet Think - Find out what the internet thinks about anything
4) https://t.co/vuhT6jVItx - Send notes that will self-destruct after being read.


1/x Fort Detrick History
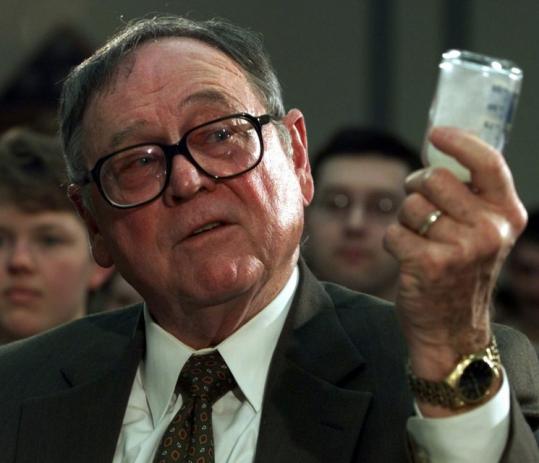
Mr. Patrick, one of the chief scientists at the Army Biological Warfare Laboratories at Fort Detrick in Frederick, Md., held five classified US patents for the process of weaponizing anthrax.
2/x
Under Mr. Patrick’s direction, scientists at Fort Detrick developed a tularemia agent that, if disseminated by airplane, could cause casualties & sickness over 1000s mi². In a 10,000 mi² range, it had 90% casualty rate & 50% fatality rate
3/x His team explored Q fever, plague, & Venezuelan equine encephalitis, testing more than 20 anthrax strains to discern most lethal variety. Fort Detrick scientists used aerosol spray systems inside fountain pens, walking sticks, light bulbs, & even in 1953 Mercury exhaust pipes

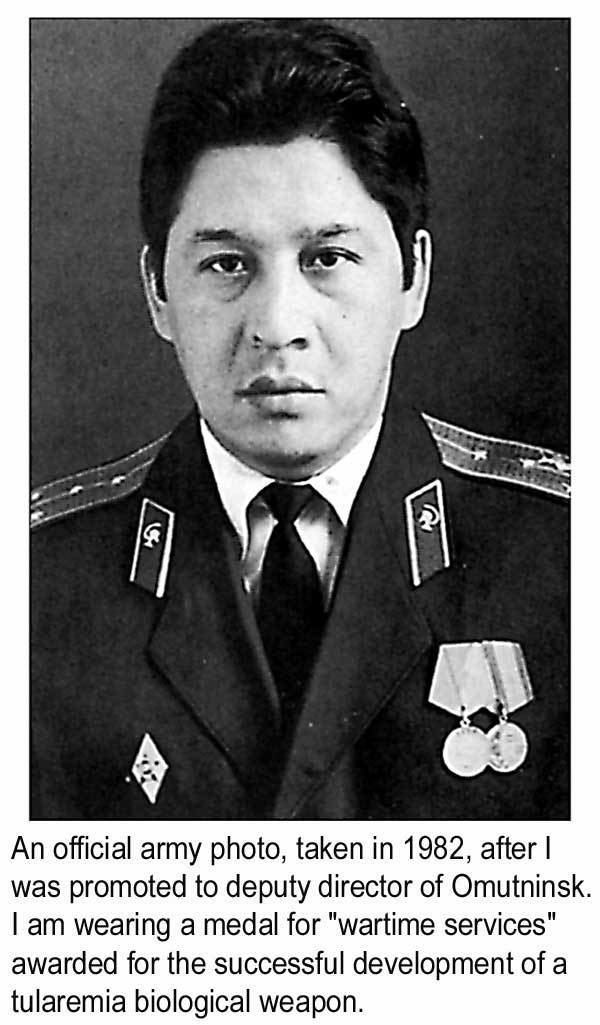
4/x After retiring in 1986, Mr. Patrick remained one of the world’s foremost specialists on biological warfare & was a consultant to the CIA, FBI, & US military. He debriefed Soviet defector Ken Alibek, the deputy chief of the Soviet biowarfare program
https://t.co/sHqSaTSqtB
5/x Back in Time
In 1949 the Army created a small team of chemists at "Camp Detrick" called Special Operations Division. Its assignment was to find military uses for toxic bacteria. The coercive use of toxins was a new field, which fascinated Allen Dulles, later head of the CIA
Mr. Patrick, one of the chief scientists at the Army Biological Warfare Laboratories at Fort Detrick in Frederick, Md., held five classified US patents for the process of weaponizing anthrax.
2/x
Under Mr. Patrick’s direction, scientists at Fort Detrick developed a tularemia agent that, if disseminated by airplane, could cause casualties & sickness over 1000s mi². In a 10,000 mi² range, it had 90% casualty rate & 50% fatality rate
3/x His team explored Q fever, plague, & Venezuelan equine encephalitis, testing more than 20 anthrax strains to discern most lethal variety. Fort Detrick scientists used aerosol spray systems inside fountain pens, walking sticks, light bulbs, & even in 1953 Mercury exhaust pipes
4/x After retiring in 1986, Mr. Patrick remained one of the world’s foremost specialists on biological warfare & was a consultant to the CIA, FBI, & US military. He debriefed Soviet defector Ken Alibek, the deputy chief of the Soviet biowarfare program
https://t.co/sHqSaTSqtB
5/x Back in Time
In 1949 the Army created a small team of chemists at "Camp Detrick" called Special Operations Division. Its assignment was to find military uses for toxic bacteria. The coercive use of toxins was a new field, which fascinated Allen Dulles, later head of the CIA