Let us decode this metric.
Layman’s explanation to PE Ratio and how it works.
A long thread! Do Bookmark this for patient reading.
#investing #investors #PEratio
Let us decode this metric.
•How to decide what to buy?
oCase A: Case A: Fresh Apple vs Stale Apple
oCase B: Costlier Fresh Apple v/s Cheaper Fresh Apple
oCase C: Apple vs Orange
•How to read PE ratio
•How is PE Ratio misunderstood?
•When will PE Ratio not work?

Apple ‘A’ is fresh and juicy. Apple ‘B’ is clearly stale. Apple ‘A’ costs you ₹.20 while Apple ‘B’ costs you only ₹.10.


The answer would clearly differ from person to person. This decision is subjective. Different things have different utilities.
This is so relatable in stock market. Companies making different products and belonging to different industries can not be compared.
All the above cases so discussed can be linked to PE ratio.
PE ratio= Market Price/ Earnings Per Share (EPS)
In other words, it is nothing but the market price one is ready to pay for every rupee earned by the company per share every year.
A ‘Nestle’ must not be compared with an ‘Asian Paints’! The reason is what we discussed in ‘Case C’. ‘Apples’ and ‘Oranges’ are not comparable!

Investors can be misled if they use this metric in case of cyclical or seasonal stocks.
More from swapnilkabra

More from Finance


Thread: P&F Super Pattern
An effective price pattern defined using properties of P&F charts.
#Superpattern #Pointandfigure #Definedge
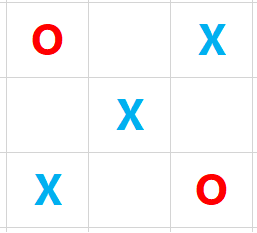
Point & Figure is an oldest charting method where price is plotted vertically, and the chart moves only when price moves. It is a different way of looking at the price, the objective box-value and reversal value offers advantage of identifying objective price patterns.
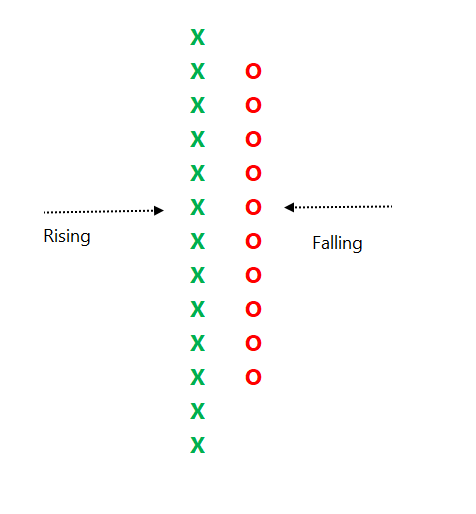
When price is moving up, it is plotted in a column of 'X'. When it is going down, it is plotted in a column of ‘O’. Normally, three-box reversal criteria is used to define the trend & reversal. Unlike a bar or candle, the P&F column can have multiple sessions in it.
Link to know more about the subject:
https://t.co/2xtLAVPBvm
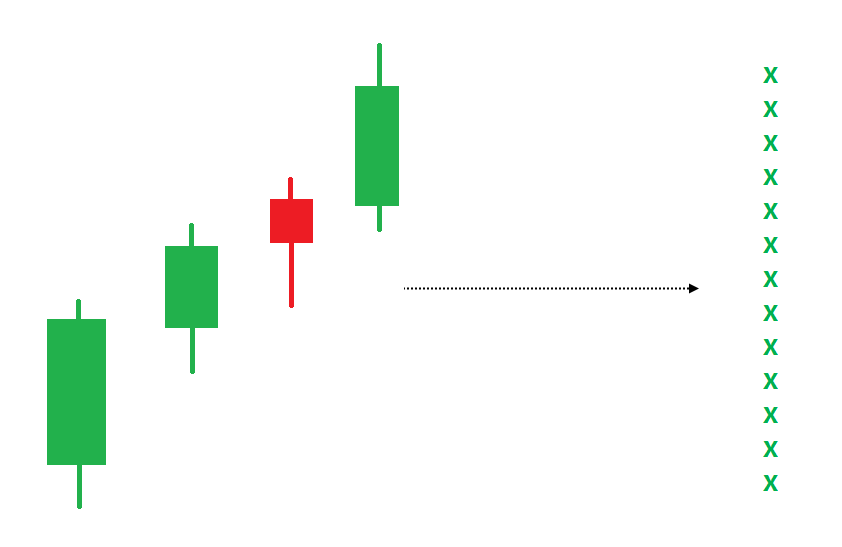
See below chart. Price is in a strong uptrend, P&F chart would produce a long of column of 'X' with more number of boxes in it.
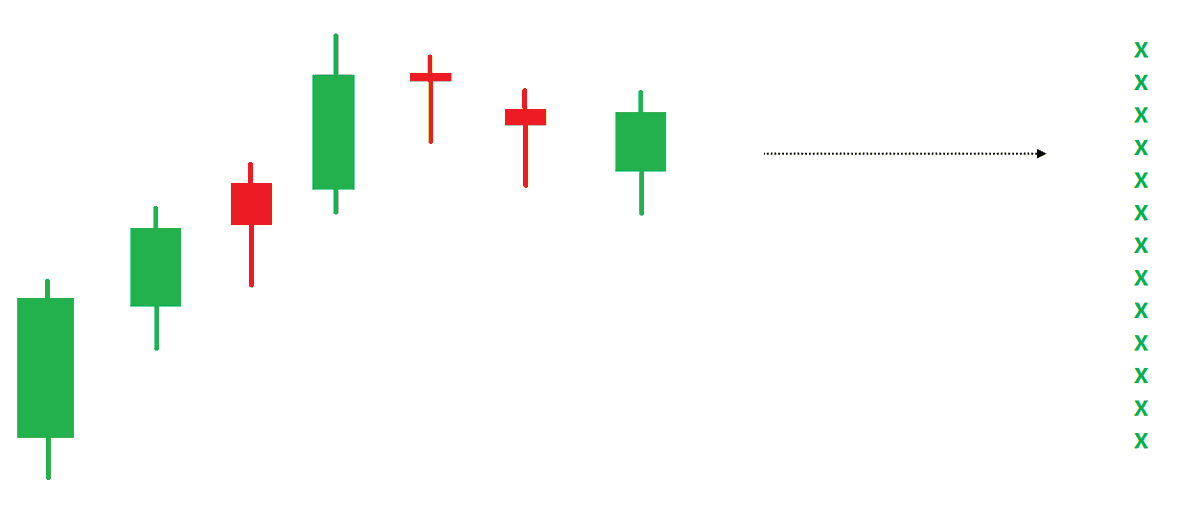
If such a trend is followed by some time bars without meaningful price correct, P&F chart would not move, and it will remain in column of 'X' in such a scenario.
An effective price pattern defined using properties of P&F charts.
#Superpattern #Pointandfigure #Definedge
Point & Figure is an oldest charting method where price is plotted vertically, and the chart moves only when price moves. It is a different way of looking at the price, the objective box-value and reversal value offers advantage of identifying objective price patterns.
When price is moving up, it is plotted in a column of 'X'. When it is going down, it is plotted in a column of ‘O’. Normally, three-box reversal criteria is used to define the trend & reversal. Unlike a bar or candle, the P&F column can have multiple sessions in it.
Link to know more about the subject:
https://t.co/2xtLAVPBvm
See below chart. Price is in a strong uptrend, P&F chart would produce a long of column of 'X' with more number of boxes in it.
If such a trend is followed by some time bars without meaningful price correct, P&F chart would not move, and it will remain in column of 'X' in such a scenario.