https://t.co/V7SzjduOgI
Complete Technical Analysis Course 🧵🧵
Step by Step Learning in 10 tweets.
Worth any webinar 20k
Kindly Re-Tweet for Max Reach 🙏
https://t.co/hHkloS6ySW
Time Frame importance -
— My First Stock (@myfirststock99) May 14, 2022
1) 3 min - For Execution
( indicators provide early signals and less reliable)
2) 15 min - to look at trend of week, Support and Resistance of last 4-5 days
3) Daily - to check current trend and Short Term S-R (More reliability)
Charts - pic.twitter.com/SWHcQQ8m0F
Join telegram for charts and Breakout Charts.
Re-Tweet First tweet if you like the work.
More from My First Stock
Mistakes to avoid in Intraday 🧵🧵
8 Years Experience in 8 Tweets
Worth any workshop of 10-15k
Re-Tweet Like to help others 🙏🙏
1) Psychology Mistakes - Don't change your stand after entering a trade
Everyone think against his own trade after entering a trade.
- Don't move SL accept it
- Don't exit before SL hit
You analysis is💩 once you are in a trade and that will improve with time.

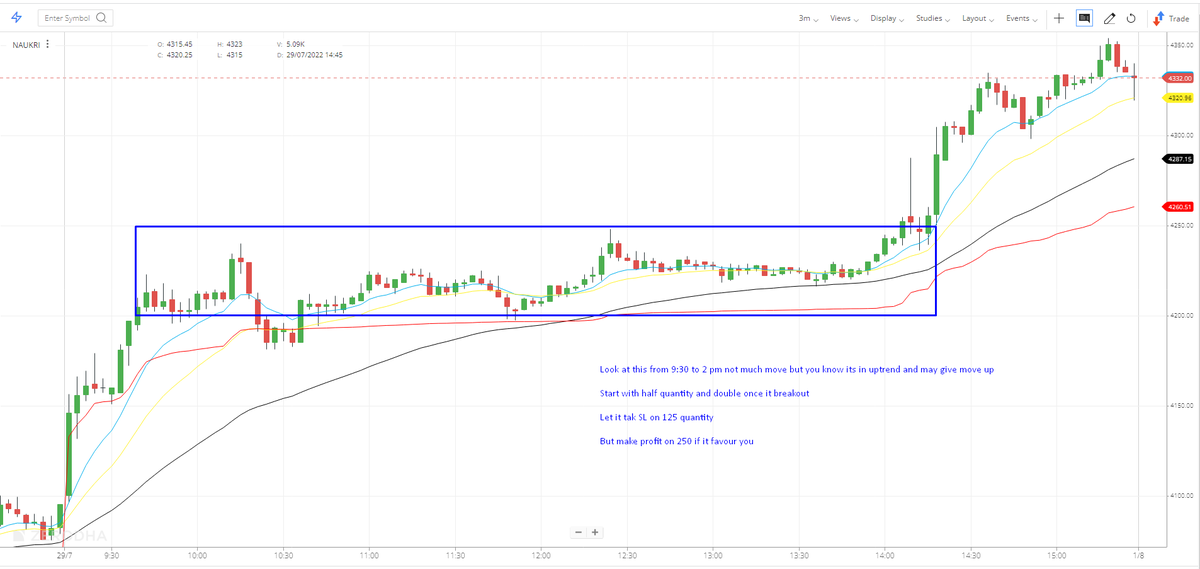
2) Position Size Mistakes - Don't enter with big quantity at once
Intraday is a game of small SL and you might hit SL even if your analysis is correct.
Give chart some space to move and let it take your SL of 1000 quantity but if it moves in your fav then increase it to 2-3k
3) Still want to take Big Position size ??
Only when SL is very tight -
1) Naukri - Explained in chart
2) Reversal Big Quantity explained in BNF
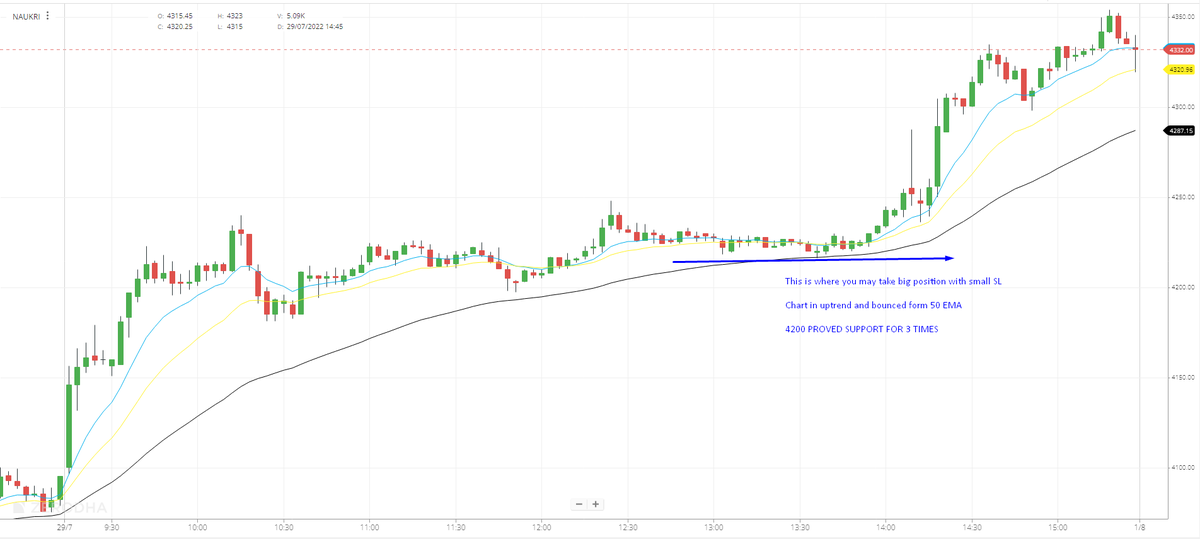
4) Time frame mistakes -
Many beginners only trade with 3-5 min TF
Dude you know nothing in 3-5 min TF, its like taking trades from ground floor and pro traders checking daily TF are at 5th floor.
Their sight from 5th floor is better
Explained here
8 Years Experience in 8 Tweets
Worth any workshop of 10-15k
Re-Tweet Like to help others 🙏🙏
1) Psychology Mistakes - Don't change your stand after entering a trade
Everyone think against his own trade after entering a trade.
- Don't move SL accept it
- Don't exit before SL hit
You analysis is💩 once you are in a trade and that will improve with time.
2) Position Size Mistakes - Don't enter with big quantity at once
Intraday is a game of small SL and you might hit SL even if your analysis is correct.
Give chart some space to move and let it take your SL of 1000 quantity but if it moves in your fav then increase it to 2-3k
3) Still want to take Big Position size ??
Only when SL is very tight -
1) Naukri - Explained in chart
2) Reversal Big Quantity explained in BNF
4) Time frame mistakes -
Many beginners only trade with 3-5 min TF
Dude you know nothing in 3-5 min TF, its like taking trades from ground floor and pro traders checking daily TF are at 5th floor.
Their sight from 5th floor is better
Explained here
Time Frame importance -
— My First Stock (@myfirststock99) May 14, 2022
1) 3 min - For Execution
( indicators provide early signals and less reliable)
2) 15 min - to look at trend of week, Support and Resistance of last 4-5 days
3) Daily - to check current trend and Short Term S-R (More reliability)
Charts - pic.twitter.com/SWHcQQ8m0F

A thread full of Learning Threads🧵🧵
1) How to Read candles
2) How to use Trading view Screeners
3) How to create custom screeners
4) Find Multibagger stocks
5) Intraday chart analysis
6) Fundamental terms
7) Straddle buying strategy
Kindly Re Tweet for max reach 🙏
1) Candlestick analysis
2) Trading View
3) Create custom screeners
4) Find Multibagger Stocks
1) How to Read candles
2) How to use Trading view Screeners
3) How to create custom screeners
4) Find Multibagger stocks
5) Intraday chart analysis
6) Fundamental terms
7) Straddle buying strategy
Kindly Re Tweet for max reach 🙏
1) Candlestick analysis
Candlesticks are Base for Analysis of Charts
— My First Stock (@myfirststock99) August 15, 2022
Here are the 10 Candlestick patterns you must know
A Thread \U0001f9f5\U0001f9f5
Kindly Re-Tweet for Max Reach
2) Trading View
How to create Screeners on Trading View
— My First Stock (@myfirststock99) October 15, 2022
A Thread \U0001f9f5\U0001f9f5
Gold standard info if you can integrate for intraday
Kindly Re-Tweet for Max Reach \U0001f64f
3) Create custom screeners
How to Create Screeners on Chart Ink
— My First Stock (@myfirststock99) May 28, 2022
A Thread with 10 Screeners\U0001f9f5\U0001f9f5\U0001f9f5
Kindly Re-Tweet Like for Max Reach
Lets Help \U0001f64f
4) Find Multibagger Stocks
How to Find Multibagger Stocks
— My First Stock (@myfirststock99) August 27, 2022
How to create screeners and use them
How to read charts \U0001f9f5\U0001f9f5
A thread of all my Threads
Kindly Re-Tweet to help others \U0001f64f
More from Catagory trading







You May Also Like


Recently, the @CNIL issued a decision regarding the GDPR compliance of an unknown French adtech company named "Vectaury". It may seem like small fry, but the decision has potential wide-ranging impacts for Google, the IAB framework, and today's adtech. It's thread time! 👇
It's all in French, but if you're up for it you can read:
• Their blog post (lacks the most interesting details): https://t.co/PHkDcOT1hy
• Their high-level legal decision: https://t.co/hwpiEvjodt
• The full notification: https://t.co/QQB7rfynha
I've read it so you needn't!
Vectaury was collecting geolocation data in order to create profiles (eg. people who often go to this or that type of shop) so as to power ad targeting. They operate through embedded SDKs and ad bidding, making them invisible to users.
The @CNIL notes that profiling based off of geolocation presents particular risks since it reveals people's movements and habits. As risky, the processing requires consent — this will be the heart of their assessment.
Interesting point: they justify the decision in part because of how many people COULD be targeted in this way (rather than how many have — though they note that too). Because it's on a phone, and many have phones, it is considered large-scale processing no matter what.
It's all in French, but if you're up for it you can read:
• Their blog post (lacks the most interesting details): https://t.co/PHkDcOT1hy
• Their high-level legal decision: https://t.co/hwpiEvjodt
• The full notification: https://t.co/QQB7rfynha
I've read it so you needn't!
Vectaury was collecting geolocation data in order to create profiles (eg. people who often go to this or that type of shop) so as to power ad targeting. They operate through embedded SDKs and ad bidding, making them invisible to users.
The @CNIL notes that profiling based off of geolocation presents particular risks since it reveals people's movements and habits. As risky, the processing requires consent — this will be the heart of their assessment.
Interesting point: they justify the decision in part because of how many people COULD be targeted in this way (rather than how many have — though they note that too). Because it's on a phone, and many have phones, it is considered large-scale processing no matter what.