Intraday Technical Analysis

Mini Course 🧵🧵 (Free)

How to Enter Long and Short Trade

Explained with 30+ Charts

Kindly Re-Tweet and Like for Max Reach 🙏

Index

1) Importance of Trend
2) Time Frame Importance
3) Bullish Day Signals
- Candles, VWAP, EMA, Patterns, Resistance BO
4) Bearish Signals

Imp - Explanation in Charts Only
Importance of Trend

"Trend is our Friend except at the end when it bends"

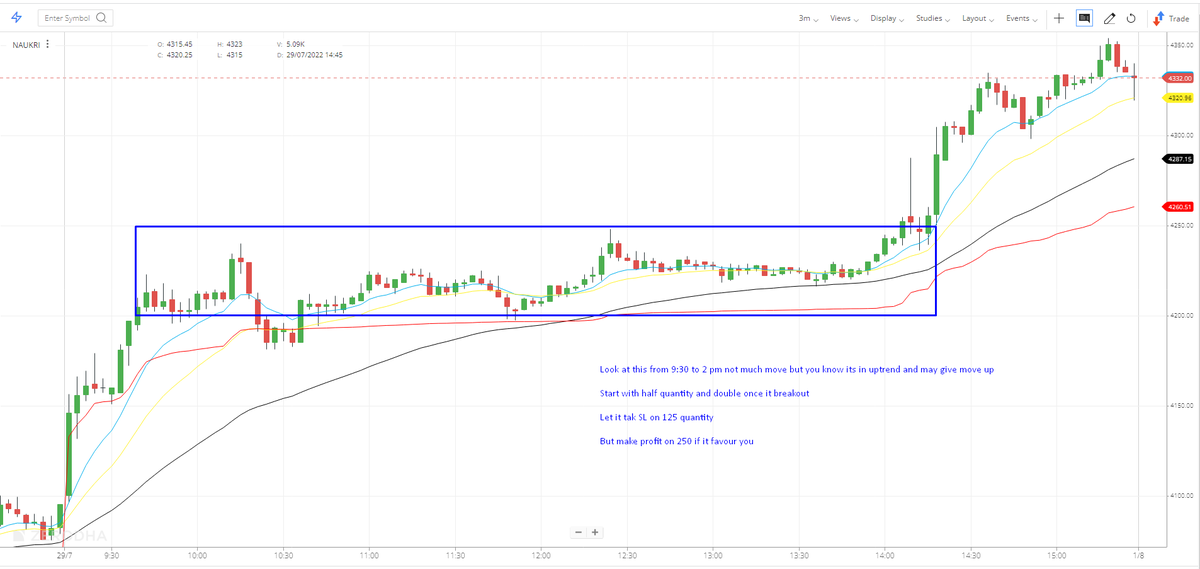
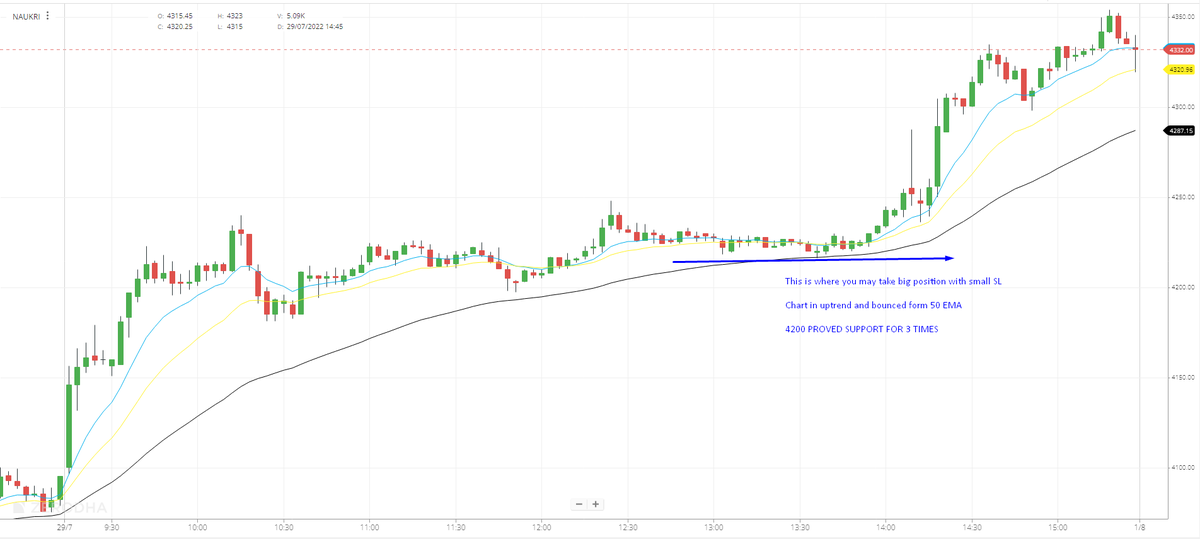
Trend Following importance explained in 4 charts -

Going against the trend stands very less chance of success as explained in this chart that cover 5 days of uptrend -
Time Frame importance -

1) 3 min - For Execution
( indicators provide early signals and less reliable)
2) 15 min - to look at trend of week, Support and Resistance of last 4-5 days
3) Daily - to check current trend and Short Term S-R (More reliability)

Charts -
Bullish Day Trading Signals

1) First Big Green Candle

First candle is always a good signal and trend setter for the day. Trading in direction of that candle have more success chances

E.g Reliance Big candle on 9 March, Entry with SL below first candle

Success Rate > 60%
2) VWAP Reaction -

For first 15 min best indicator is VWAP -

1) Chart Reaction with VWAP on a bullish day is explained in 4 charts here -
3) 10-20-50 EMA Reaction -

Only on steep up moves, charts get support by 10 ema and do not break that. like 8-10% pump

Bounce from 20 Ema support is a good entry point with SL below low of last 2-3 candles

EMA Confluence and Crossover Entry

Explained with 3 charts -
Candles - ( Useful on Bullish Day )

1) Breakout Candle
2) Dragon Fly Doji on consolidation - Enter in next candle once the price is above the high of Doji and keep SL below low of Doji
3) Bullish Engulfing

Explained in 3 charts
Pattern/Signals on Bullish Day -

1) Ascending Triangle Breakout - Most Common
2) Resistance Breakout
3) New High of Day
4) Bounce from last high of Same Day

Explained in Charts -
Some Important Points -

1) Never Trade against the Big Candles
2) Never trade against the trend
3) Never trade without SL
4) Don't move SL accept it
5) 1:2 Risk Reward is minimum to take trade
6) 50% Win Rate is excellent
7) Try to make profit according to capital Only
Signals to Enter Short Trade -

1) VWAP Signals

Look at this reliance chart -

- First Big Red Candel is always a good short signal
- Continuous rejection from VWAP is good to enter short
2) VWAP Rejection support broken
3) Bearish Engulfing - Big Red Candle
4) Go Short on First Candle
5) EMA Confluence and rejection
6) Below Support Entry
7) Below day's low enter short trade
Please follow my handle @myfirststock99 as I keep posting learning stuff regularly

Do Join telegram also link in profile

One can Join Premium referral group without any cost by opening demat account from our link in Pinned tweet

More from My First Stock

More from Trading strategies

STOCK TRADING STRATEGIES to get started today...💸

Here are 6⃣ simple strategies which you can use if you are still struggling to trade cash stocks!

They are very simple yet very effective if you can stick to them🤓

Ready to learn?

Let's go🧵...

1⃣ CCI & Pivot based strategy to ride massive trends in stocks

Don't forget to checkout the fundamental


2⃣ Multi-time frame positional strategy based on CCI with


3⃣ Only CCI based investment strategy - You can catch massive trends in stocks with good Sales/PAT growth using this


4⃣ Tradingview code for strategy shared by @heartwon based on the long term and short term

You May Also Like

The first ever world map was sketched thousands of years ago by Indian saint
“Ramanujacharya” who simply translated the following verse from Mahabharat and gave the world its real face

In Mahabharat,it is described how 'Maharishi Ved Vyasa' gave away his divine vision to Sanjay


Dhritarashtra's charioteer so that he could describe him the events of the upcoming war.

But, even before questions of war could begin, Dhritarashtra asked him to describe how the world looks like from space.

This is how he described the face of the world:

सुदर्शनं प्रवक्ष्यामि द्वीपं तु कुरुनन्दन। परिमण्डलो महाराज द्वीपोऽसौ चक्रसंस्थितः॥
यथा हि पुरुषः पश्येदादर्शे मुखमात्मनः। एवं सुदर्शनद्वीपो दृश्यते चन्द्रमण्डले॥ द्विरंशे पिप्पलस्तत्र द्विरंशे च शशो महान्।

—वेद व्यास, भीष्म पर्व, महाभारत


Meaning:-

हे कुरुनन्दन ! सुदर्शन नामक यह द्वीप चक्र की भाँति गोलाकार स्थित है, जैसे पुरुष दर्पण में अपना मुख देखता है, उसी प्रकार यह द्वीप चन्द्रमण्डल में दिखायी देता है। इसके दो अंशो मे पीपल और दो अंशो मे विशाल शश (खरगोश) दिखायी देता है।


Meaning: "Just like a man sees his face in the mirror, so does the Earth appears in the Universe. In the first part you see leaves of the Peepal Tree, and in the next part you see a Rabbit."

Based on this shloka, Saint Ramanujacharya sketched out the map, but the world laughed
A THREAD ON @SarangSood

Decoded his way of analysis/logics for everyone to easily understand.

Have covered:
1. Analysis of volatility, how to foresee/signs.
2. Workbook
3. When to sell options
4. Diff category of days
5. How movement of option prices tell us what will happen

1. Keeps following volatility super closely.

Makes 7-8 different strategies to give him a sense of what's going on.

Whichever gives highest profit he trades in.


2. Theta falls when market moves.
Falls where market is headed towards not on our original position.


3. If you're an options seller then sell only when volatility is dropping, there is a high probability of you making the right trade and getting profit as a result

He believes in a market operator, if market mover sells volatility Sarang Sir joins him.


4. Theta decay vs Fall in vega

Sell when Vega is falling rather than for theta decay. You won't be trapped and higher probability of making profit.