A bullish engulfing pattern is a candlestick pattern that forms when a red candle is followed the next day by a large green candle, the body of which completely overlaps or engulfs the body of the previous day’s candlestick.
https://t.co/NQhXQskg8H
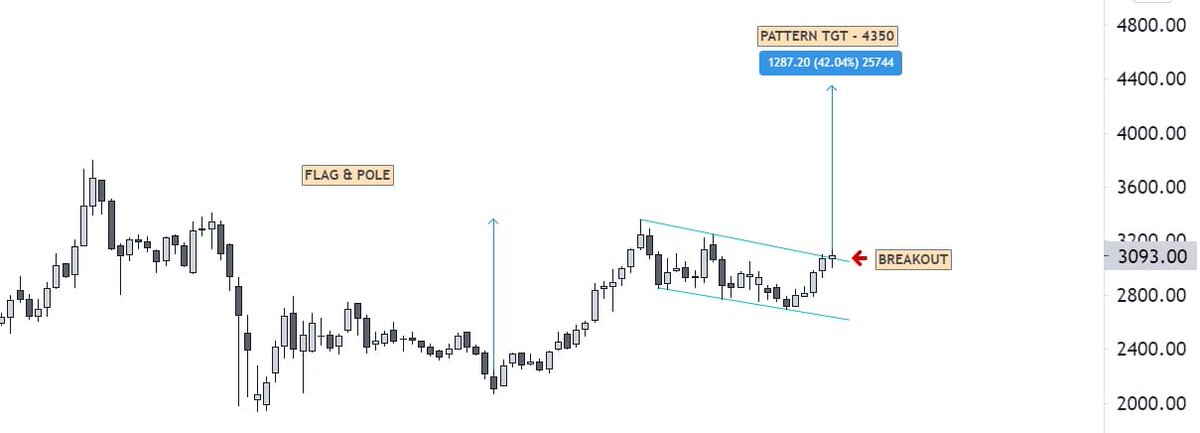
There are 4\u20e3 type of #BREAKOUTS
— The Chartians (@chartians) January 22, 2021
1\u20e3 Breakout with no retest
2\u20e3 Breakout with a re-test
3\u20e3 Breakout with a hard re-test
4\u20e3 Failed breakout.
We Will Explain it one by one with examples. Kindly Retweet it if you find it useful. #Nifty
A detailed guide on #TX3 by @EdelweissFin
— The Chartians (@chartians) August 8, 2021
Software worth 50,000/- for F R E E \U0001f3c6
Scroll down \U0001f447 for detailed analysis
(Using for 2+years)
User guide PDF \U0001f4d9 https://t.co/Ke7Bn2jRO8 #chartians #momentum #StockMarketindia #trading #tx3 #edelweiss pic.twitter.com/6M7TCYpPLc
\U0001fa78FIBONACCI retracement and GOLDEN RATIO - PART 2
— The Chartians (@chartians) August 8, 2021
Before we move forward, kindly like and retweet if you find our content is adding something to your knowledge. pic.twitter.com/HDlcOa5ZPP
\U0001fa78FIBONACCI retracement and GOLDEN RATIO
— The Chartians (@chartians) August 7, 2021
Before we move forward, kindly like and retweet if you find our content is adding something to your knowledge. pic.twitter.com/iVC6W3pqks
Trading on chart patterns is difficult, Until you see this:
— The Chartians (@chartians) August 6, 2022
Free Technical Analysis course (1/10) \U0001f9f5
Trading on chart patterns is difficult, Until you read this ! \u26a1\ufe0f
— The Chartians (@chartians) August 21, 2022
Everything about Cup and Handle Pattern
Free Technical Analysis course (2/10) \U0001f9f5
Trading on chart patterns is difficult until you read this !\u26a1\ufe0f
— The Chartians (@chartians) August 28, 2022
Everything about Ascending Triangle Pattern
Free Technical Analysis course (3/10) \U0001f9f5
Trading on chart patterns is difficult, Until you read this ! \u26a1\ufe0f
— The Chartians (@chartians) October 9, 2022
Everything about Head and Shoulder Pattern
Free Technical Analysis course (4/10) \U0001f9f5
Candlesticks are Base for Analysis of Charts
— My First Stock (@myfirststock99) August 15, 2022
Here are the 10 Candlestick patterns you must know
A Thread \U0001f9f5\U0001f9f5
Kindly Re-Tweet for Max Reach
How to create Screeners on Trading View
— My First Stock (@myfirststock99) October 15, 2022
A Thread \U0001f9f5\U0001f9f5
Gold standard info if you can integrate for intraday
Kindly Re-Tweet for Max Reach \U0001f64f
How to Create Screeners on Chart Ink
— My First Stock (@myfirststock99) May 28, 2022
A Thread with 10 Screeners\U0001f9f5\U0001f9f5\U0001f9f5
Kindly Re-Tweet Like for Max Reach
Lets Help \U0001f64f
How to Find Multibagger Stocks
— My First Stock (@myfirststock99) August 27, 2022
How to create screeners and use them
How to read charts \U0001f9f5\U0001f9f5
A thread of all my Threads
Kindly Re-Tweet to help others \U0001f64f
As Traders, Technical Analysis allows us to Judge Potential, Identify Accumulation, and Manage Risk.
— Richard Moglen \U0001f981 (@RichardMoglen) April 2, 2022
It allows us to see through the noise and interpret price action.
Here is How To Read a Stock Chart For Beginners (Thread)
The best traders have a trading plan.
— Aditya Todmal (@AdityaTodmal) February 13, 2022
But 98.8% of the new traders, don't know how to make one.
I analyzed @niki_poojary's account, to learn how we can create a plan on our own.
Here's the simple 8-step process:\U0001f9f5
Strategy to make higher returns in Short duration :-
— Flamingo Trader |Ankit Saraswat (@FlamingoTrader_) February 21, 2022
Thread on Darvas Box Theory:-
\U0001f9f5@FlamingoTrader_
Telling my 8 years of experience in 5 min. A thread on how to find out high and lows of stock market.
— W D Gann Trader (@Bjybnf) August 5, 2022
Time Frame importance -
— My First Stock (@myfirststock99) May 14, 2022
1) 3 min - For Execution
( indicators provide early signals and less reliable)
2) 15 min - to look at trend of week, Support and Resistance of last 4-5 days
3) Daily - to check current trend and Short Term S-R (More reliability)
Charts - pic.twitter.com/SWHcQQ8m0F