Stocks that are bullish have the characteristics that they continue to make new highs. One of the best ways to identify such stocks is to look out for the stocks that are in the 25% range of all-time high levels.
IN TRADING, THE TREND IS YOUR FRIEND!
Buying a weak stock and Selling a strong stock is a crime in trading.
Sharing 3 SIMPLE methods that a buyer can use to identify strong stocks in an uptrend and increase the probability of success.
Sharing screeners link to help you out!
Stocks that are bullish have the characteristics that they continue to make new highs. One of the best ways to identify such stocks is to look out for the stocks that are in the 25% range of all-time high levels.
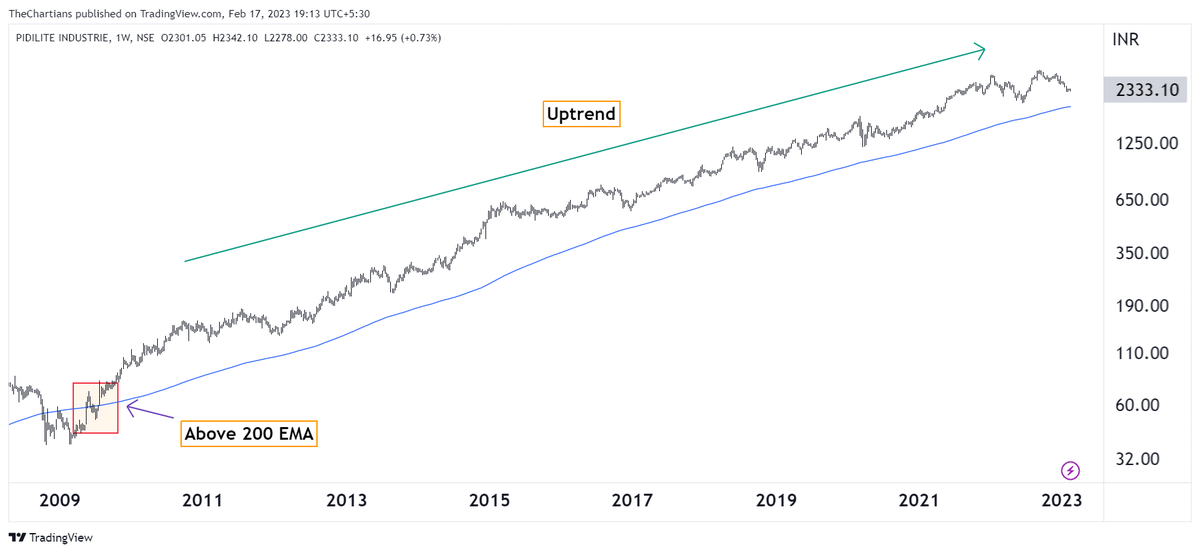
Investors can use 200 EMA on the weekly time frame and any stock that is above it can be considered as a strong stock in investment.
Pidilite is above 200 EMA since 2010 and it has created enormous wealth for investors.
https://t.co/iwXDnSvwzl
Traders can use 200 EMA on the daily time frame and any stock that is above it can be considered as a strong stock in investment.
Screener Link: https://t.co/OdhkEtn8H4
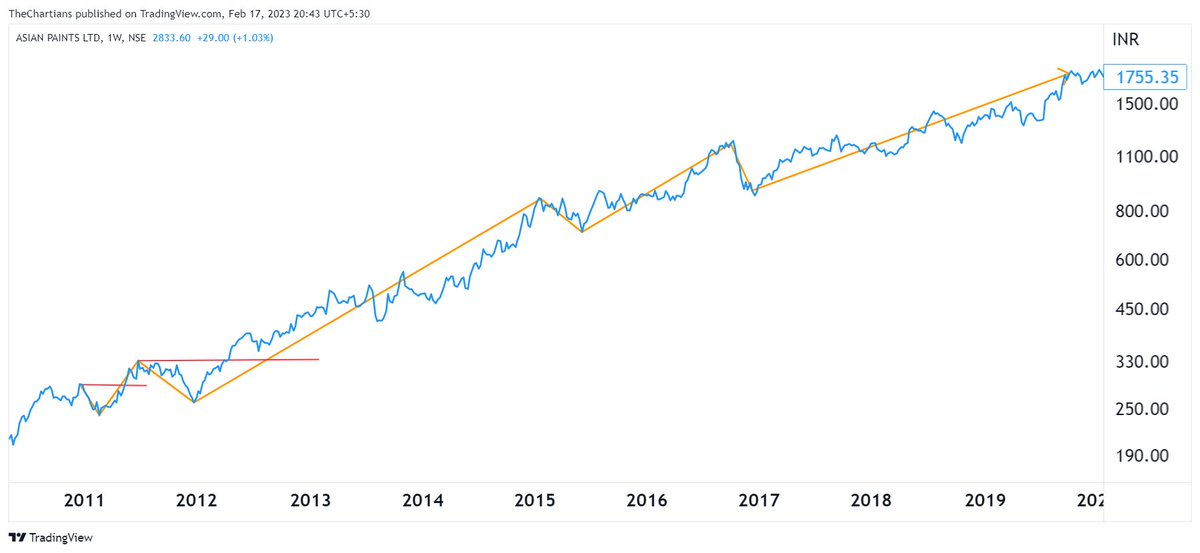
There are two trends that can be identified using Dow theory.
Uptrend: Price forming Higher Lows and Higher Highs
Downtrend: Price forming Lower Highs and Lower Lows
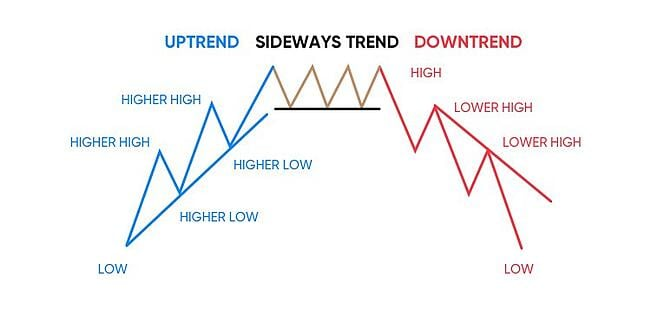
In Asian Paints charts, we can see how previous high is breaking and lows are getting shifted upward which means a stock is strong.
If you found this useful, please RT the first tweet.
For live trading and stock market related updates, you can join our Telegram Channel⤵️
https://t.co/FSyDMbgo3n
More from The Chartians
Here are the compilation of free educational contents we shared till now.
Kindly RETWEET and LIKE if you feel our efforts adding to your knowledge.

🩸Types of
🩸 Detailed guide on TX, a free trading tool by
🩸 Fibonacci retracement and golder ratio - Part
🩸 Fibonacci retracement and golden ratio - Part
Kindly RETWEET and LIKE if you feel our efforts adding to your knowledge.
🩸Types of
There are 4\u20e3 type of #BREAKOUTS
— The Chartians (@chartians) January 22, 2021
1\u20e3 Breakout with no retest
2\u20e3 Breakout with a re-test
3\u20e3 Breakout with a hard re-test
4\u20e3 Failed breakout.
We Will Explain it one by one with examples. Kindly Retweet it if you find it useful. #Nifty
🩸 Detailed guide on TX, a free trading tool by
A detailed guide on #TX3 by @EdelweissFin
— The Chartians (@chartians) August 8, 2021
Software worth 50,000/- for F R E E \U0001f3c6
Scroll down \U0001f447 for detailed analysis
(Using for 2+years)
User guide PDF \U0001f4d9 https://t.co/Ke7Bn2jRO8 #chartians #momentum #StockMarketindia #trading #tx3 #edelweiss pic.twitter.com/6M7TCYpPLc
🩸 Fibonacci retracement and golder ratio - Part
\U0001fa78FIBONACCI retracement and GOLDEN RATIO - PART 2
— The Chartians (@chartians) August 8, 2021
Before we move forward, kindly like and retweet if you find our content is adding something to your knowledge. pic.twitter.com/HDlcOa5ZPP
🩸 Fibonacci retracement and golden ratio - Part
\U0001fa78FIBONACCI retracement and GOLDEN RATIO
— The Chartians (@chartians) August 7, 2021
Before we move forward, kindly like and retweet if you find our content is adding something to your knowledge. pic.twitter.com/iVC6W3pqks


More from Catagory trading




20 very useful FREE available scanners which i have gathered from various social media platforms.
Scanners for ALL TYPE OF TRADERS
Thread on scanners 🧵
If you find it useful hit a RETWEET so it can reach many traders who are searching for good scanners.

FYI - I have not created any of the below scanners and i have only tried to gather and complied various scanners at one place so it can be useful for many traders.
Join the Telegram Channel for live market updates & live market sessions
https://t.co/VU0bCGjmhU
Scroll down👇
Open =High , Open = Low scanner
https://t.co/O03NbN2vxB
Scroll down👇
Stocks above pivot point resistance level
https://t.co/mniXn7mWWF
Scroll down 👇
Stock above pivot open
https://t.co/mem0FO1b8x
Scroll down 👇
Scanners for ALL TYPE OF TRADERS
Thread on scanners 🧵
If you find it useful hit a RETWEET so it can reach many traders who are searching for good scanners.
FYI - I have not created any of the below scanners and i have only tried to gather and complied various scanners at one place so it can be useful for many traders.
Join the Telegram Channel for live market updates & live market sessions
https://t.co/VU0bCGjmhU
Scroll down👇
Open =High , Open = Low scanner
https://t.co/O03NbN2vxB
Scroll down👇
Stocks above pivot point resistance level
https://t.co/mniXn7mWWF
Scroll down 👇
Stock above pivot open
https://t.co/mem0FO1b8x
Scroll down 👇

🧵 STOP wasting time searching for stocks.
Unlock the stock screener that makes it easy:
Check out the stocks that have broken through their 52-week highs on https://t.co/qBvDaqyp9R. They are some of the strongest in the market, so be sure to consider technicalities when trading them.
You've definitely heard of Darvas. Here's your chance to put his strategy into action: https://t.co/bk82BA8MMF

Intraday lovers: https://t.co/7Y866T9bRt

Do you know that narrow range breakout gives a punching returns in short span- https://t.co/vYfluY3TEH

Unlock the stock screener that makes it easy:
Check out the stocks that have broken through their 52-week highs on https://t.co/qBvDaqyp9R. They are some of the strongest in the market, so be sure to consider technicalities when trading them.
You've definitely heard of Darvas. Here's your chance to put his strategy into action: https://t.co/bk82BA8MMF
Intraday lovers: https://t.co/7Y866T9bRt
Do you know that narrow range breakout gives a punching returns in short span- https://t.co/vYfluY3TEH