Categories Catagory trading


How to create screeners and use them
How to read charts 🧵🧵
A thread of all my Threads
Kindly Re-Tweet to help others 🙏
1) How to find #Stocks for Short Term
How to find #Stocks for Short Term Momentum
— My First Stock (@myfirststock99) May 21, 2022
A thread with 10 Screeners \U0001f9f5\U0001f9f5\U0001f9f5
Kindly Re-Tweet like for Max Reach \U0001f64f
2) Important Scanners for Stock Selection
Important Scanners for Stock Selection
— My First Stock (@myfirststock99) May 3, 2022
A Thread \U0001f9f5
How to Select Stocks for Intraday and Short Term
Re-Tweet If you want to see Intraday Dashboard for alerts \U0001f64f
3) How to Create Screeners on Chart Ink
How to Create Screeners on Chart Ink
— My First Stock (@myfirststock99) May 28, 2022
A Thread with 10 Screeners\U0001f9f5\U0001f9f5\U0001f9f5
Kindly Re-Tweet Like for Max Reach
Lets Help \U0001f64f
4) Here are the 10 Candlestick patterns you must
Candlesticks are Base for Analysis of Charts
— My First Stock (@myfirststock99) August 15, 2022
Here are the 10 Candlestick patterns you must know
A Thread \U0001f9f5\U0001f9f5
Kindly Re-Tweet for Max Reach
Here are 6⃣ simple strategies which you can use if you are still struggling to trade cash stocks!
They are very simple yet very effective if you can stick to them🤓
Ready to learn?
Let's go🧵...
1⃣ CCI & Pivot based strategy to ride massive trends in stocks
Don't forget to checkout the fundamental
For 7 yrs I struggled to ride trends..
— Trendline Investor (@dmdsplyinvestor) April 30, 2022
& in 2015-17 when I started learning TA smthng crazy happened..
Here is a simple strategy that helped me..
\u2022 Identify turning points in stocks
\u2022 Find quality stocks
\u2022 Not panic & ride trends
\u2022 Finally make \U0001f4b8
CCI & Pivot Strategy\U0001f9f5.. pic.twitter.com/S0QFx00541
2⃣ Multi-time frame positional strategy based on CCI with
There are 1000s of indicators in Technical Analysis...
— Trendline Investor (@dmdsplyinvestor) May 12, 2022
But you need to MASTER ONLY ONE\U0001f3afto win in markets...
I selected 'Commodity channel index' (CCI) as my PRIMARY INDICATOR & all my scanners are a variation of this...
MULTI TIMEFRAME POSITIONAL STRATEGY using CCI...\U0001f9f5 pic.twitter.com/4O2PrBxSw9
3⃣ Only CCI based investment strategy - You can catch massive trends in stocks with good Sales/PAT growth using this
My CCI based investment strategy - How does it work? A thread.
— Trendline Investor (@dmdsplyinvestor) May 23, 2020
Objective: Identify stocks that are entering a phase of momentum on the upside and ride the stock until momentum weakens.1/n
4⃣ Tradingview code for strategy shared by @heartwon based on the long term and short term
A brilliant concept based on the long term and short term EMA by @heartwon. I'm here on twitter for such stuff that helps me build my systems. Really good one. Here is the trading view indicator that I coded. Please RT for everyone's benefit. 1/3 https://t.co/uleWiysyL1
— Trendline Investor (@dmdsplyinvestor) July 5, 2020

Scanners for ALL TYPE OF TRADERS
Thread on scanners 🧵
If you find it useful hit a RETWEET so it can reach many traders who are searching for good scanners.
FYI - I have not created any of the below scanners and i have only tried to gather and complied various scanners at one place so it can be useful for many traders.
Join the Telegram Channel for live market updates & live market sessions
https://t.co/VU0bCGjmhU
Scroll down👇
Open =High , Open = Low scanner
https://t.co/O03NbN2vxB
Scroll down👇
Stocks above pivot point resistance level
https://t.co/mniXn7mWWF
Scroll down 👇
Stock above pivot open
https://t.co/mem0FO1b8x
Scroll down 👇


Very important thread for all option buyers 🧵
Just 5 to 10 minutes to read but it can change your trading a lot.
Support us by RETWEET this tweet to help more option buyers to gain knowledge & to avoid getting trapped from big players https://t.co/yBZ6Y7BaGx

Option Buying Simplified
— Learn to Trade (@learntotrade365) August 31, 2022
Very important thread for all option buyers \U0001f9f5
Just 5 minutes to read but it can change your trading a lot.
Support us by RETWEET this tweet to help most option buyers to gain knowledge & to avoid getting trapped from big players pic.twitter.com/BaaTjJix7F
I do Intraday Live Market session via Youtube Live on all trading days - Follow us on twitter @learntotrade365
Join the Telegram channel for Live Market updates and more free content.
Scroll down
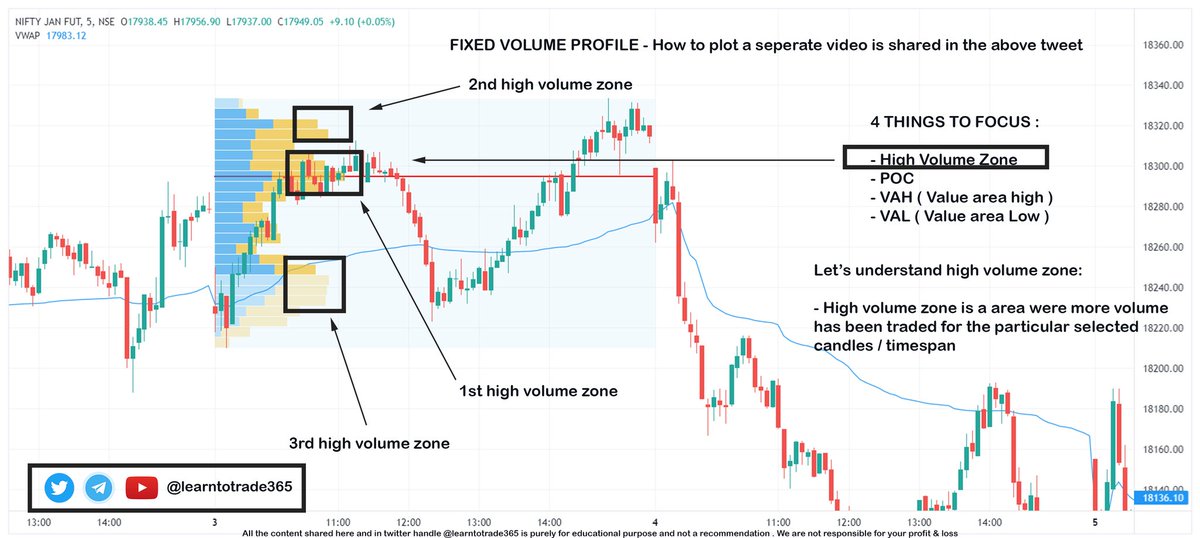
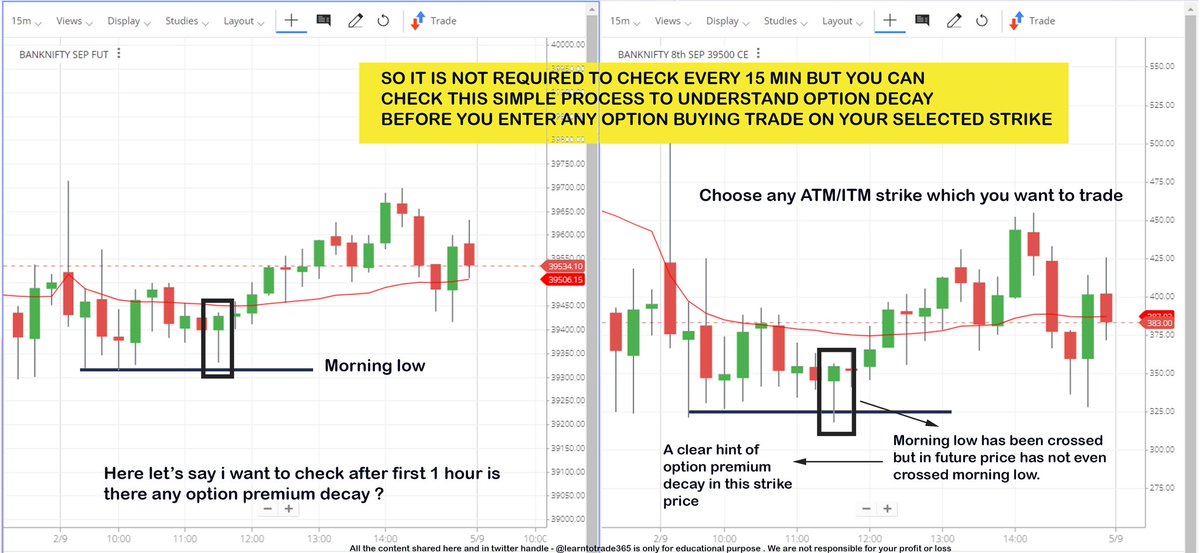
Main problem which most option buyers face is Option Premium erosion ( Theta Decay ). So I have shared a simple & effective process to understand the option decay during Live Market before entering option buying trades
Scroll down 👇
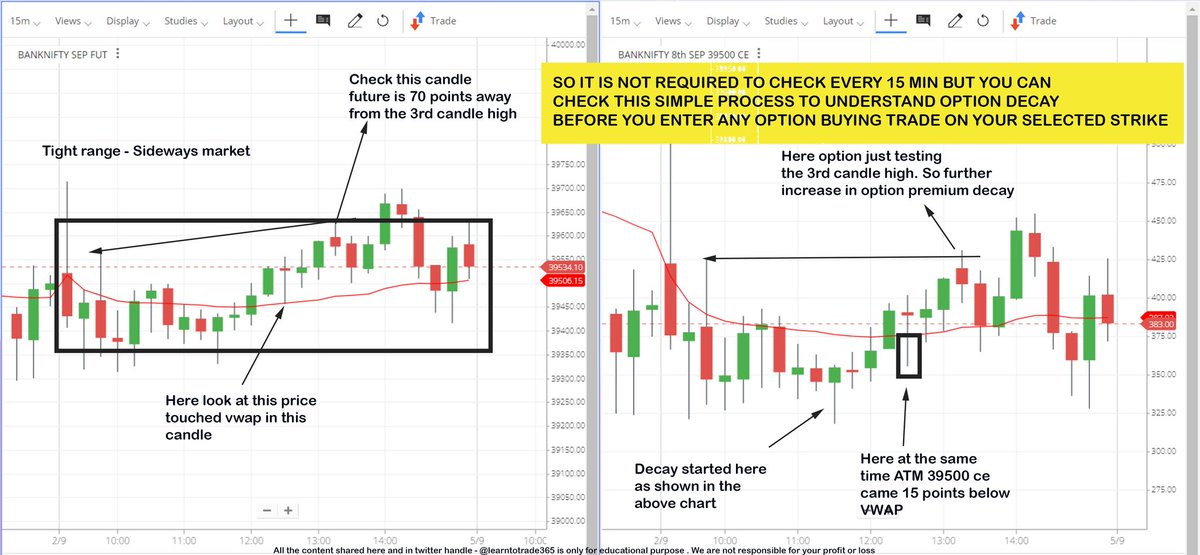
Follow up example from the above chart about Option premium decay during sideways market. In general most option premium erosion (theta decay) happens during sideways market.
Theta is option buyers ENEMY
Scroll down 👇
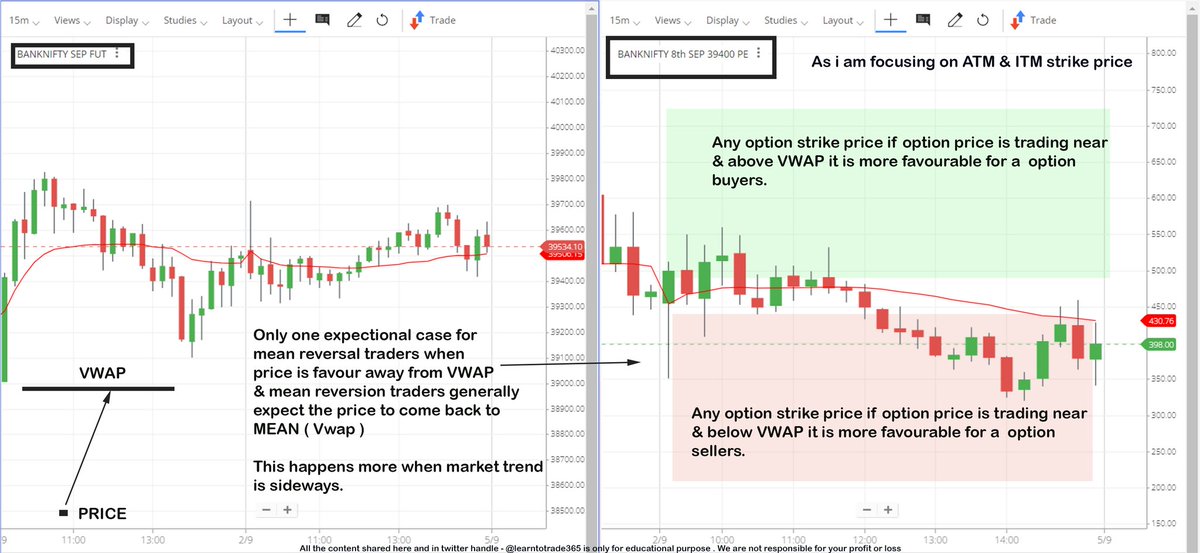
Option Buyers high probability zones while trading ATM & ITM strike prices.
VWAP helps a lot in providing data during Live Market
Scroll down 👇


Unlock the stock screener that makes it easy:
Check out the stocks that have broken through their 52-week highs on https://t.co/qBvDaqyp9R. They are some of the strongest in the market, so be sure to consider technicalities when trading them.
You've definitely heard of Darvas. Here's your chance to put his strategy into action: https://t.co/bk82BA8MMF

Intraday lovers: https://t.co/7Y866T9bRt

Do you know that narrow range breakout gives a punching returns in short span- https://t.co/vYfluY3TEH


Data says 81% of people trade these patterns incorrectly, and you might be one of them.
Read now or regret later:: A complete guide on Top 5 chart patterns in this thread 🧵:
1/ Rounding Bottom:
Rounding Bottom or U Pattern or Saucer all are one and the same with different names and it is a bullish
Trading on chart patterns is difficult, Until you see this:
— The Chartians (@chartians) August 6, 2022
Free Technical Analysis course (1/10) \U0001f9f5
2/ Cup and Handle:
A bullish technical pattern that is very popular in Technical
Trading on chart patterns is difficult, Until you read this ! \u26a1\ufe0f
— The Chartians (@chartians) August 21, 2022
Everything about Cup and Handle Pattern
Free Technical Analysis course (2/10) \U0001f9f5
3/ Ascending Triangle:
Ascending triangle is created by price moves that allow for a horizontal line to be drawn along the swing highs and a rising trendline to be drawn along the swing
Trading on chart patterns is difficult until you read this !\u26a1\ufe0f
— The Chartians (@chartians) August 28, 2022
Everything about Ascending Triangle Pattern
Free Technical Analysis course (3/10) \U0001f9f5
4/ Head and Shoulder Pattern:
It is one of several top patterns that signal an upward trend is nearing its
Trading on chart patterns is difficult, Until you read this ! \u26a1\ufe0f
— The Chartians (@chartians) October 9, 2022
Everything about Head and Shoulder Pattern
Free Technical Analysis course (4/10) \U0001f9f5