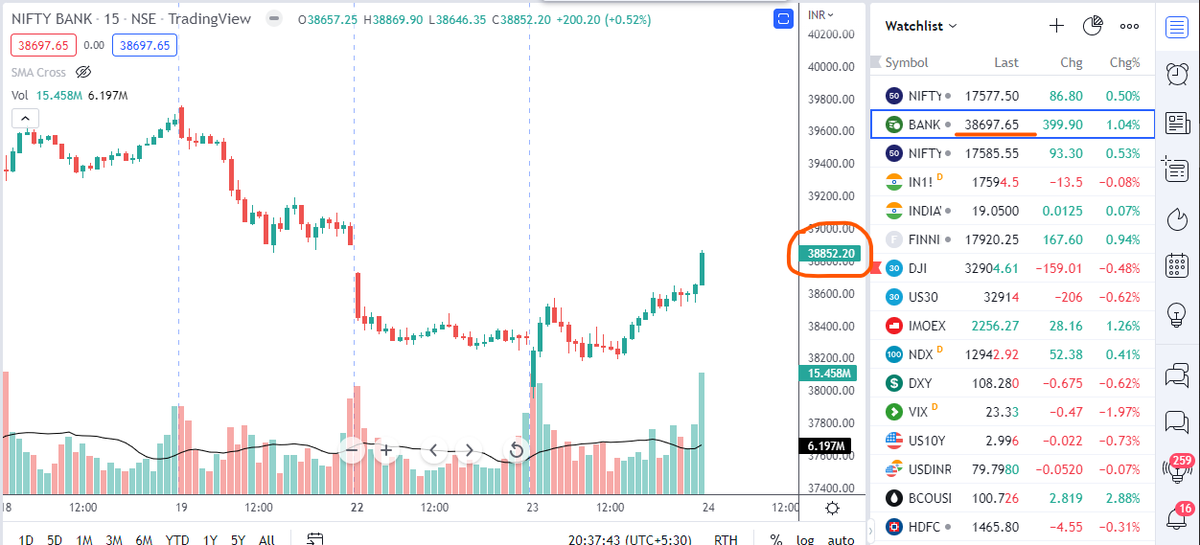
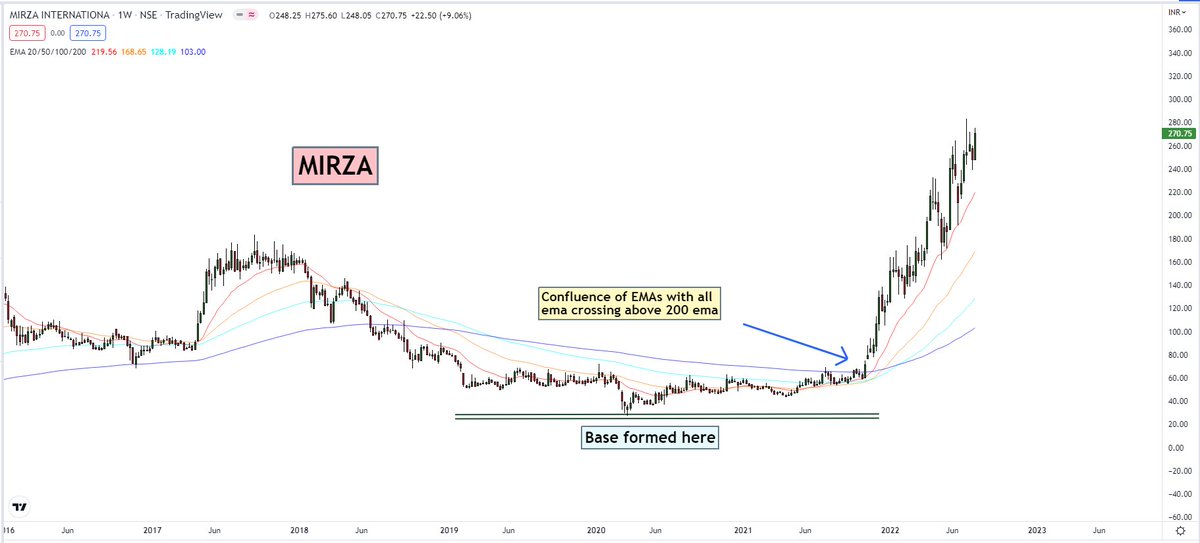
Create a screener to find EMAs confluence 20-50-100-200 on weekly time frame.
Here is the screener created just now -
https://t.co/uHjTy9Ujuv
Candlesticks are Base for Analysis of Charts
— My First Stock (@myfirststock99) August 15, 2022
Here are the 10 Candlestick patterns you must know
A Thread \U0001f9f5\U0001f9f5
Kindly Re-Tweet for Max Reach
How to create Screeners on Trading View
— My First Stock (@myfirststock99) October 15, 2022
A Thread \U0001f9f5\U0001f9f5
Gold standard info if you can integrate for intraday
Kindly Re-Tweet for Max Reach \U0001f64f
How to Create Screeners on Chart Ink
— My First Stock (@myfirststock99) May 28, 2022
A Thread with 10 Screeners\U0001f9f5\U0001f9f5\U0001f9f5
Kindly Re-Tweet Like for Max Reach
Lets Help \U0001f64f
How to Find Multibagger Stocks
— My First Stock (@myfirststock99) August 27, 2022
How to create screeners and use them
How to read charts \U0001f9f5\U0001f9f5
A thread of all my Threads
Kindly Re-Tweet to help others \U0001f64f
For three years I have wanted to write an article on moral panics. I have collected anecdotes and similarities between today\u2019s moral panic and those of the past - particularly the Satanic Panic of the 80s.
— Ashe Schow (@AsheSchow) September 29, 2018
This is my finished product: https://t.co/otcM1uuUDk