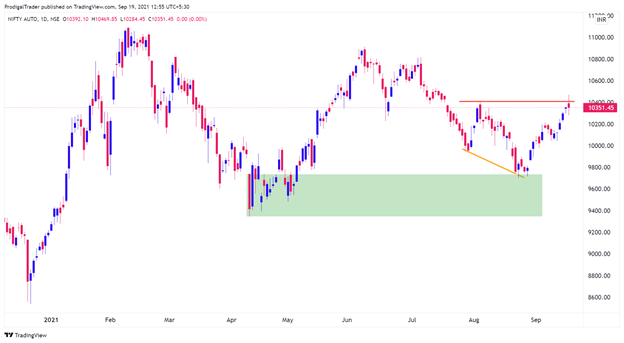
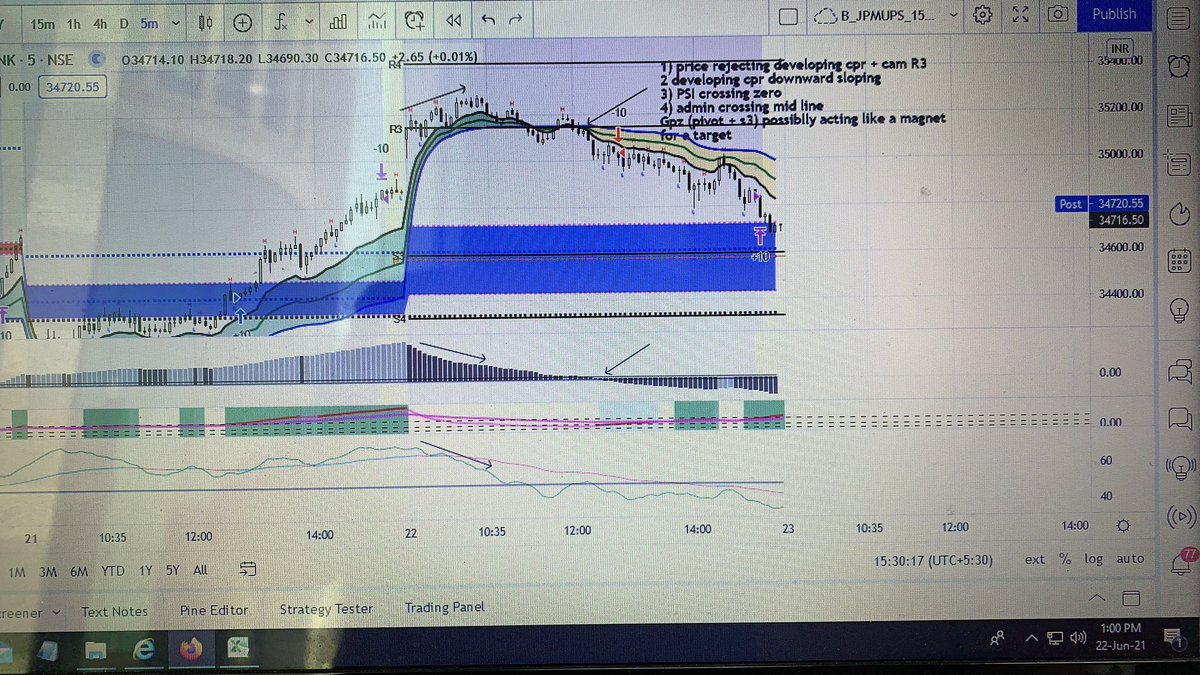
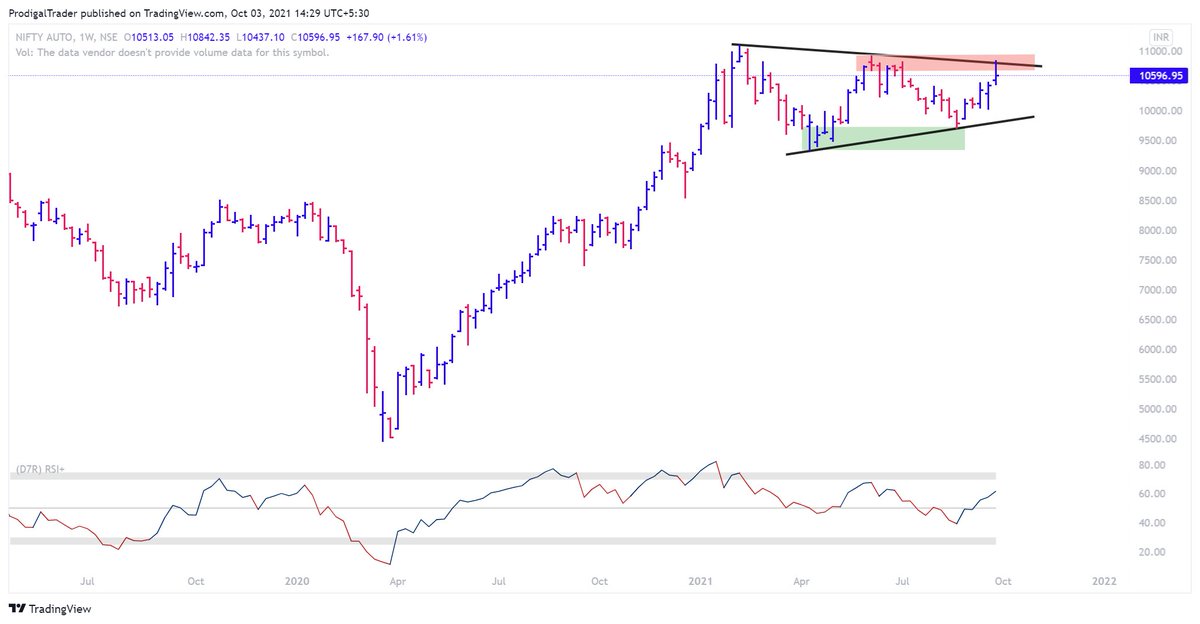
shooting start at the resistance line of a triangle and at a major supply zone
2/7


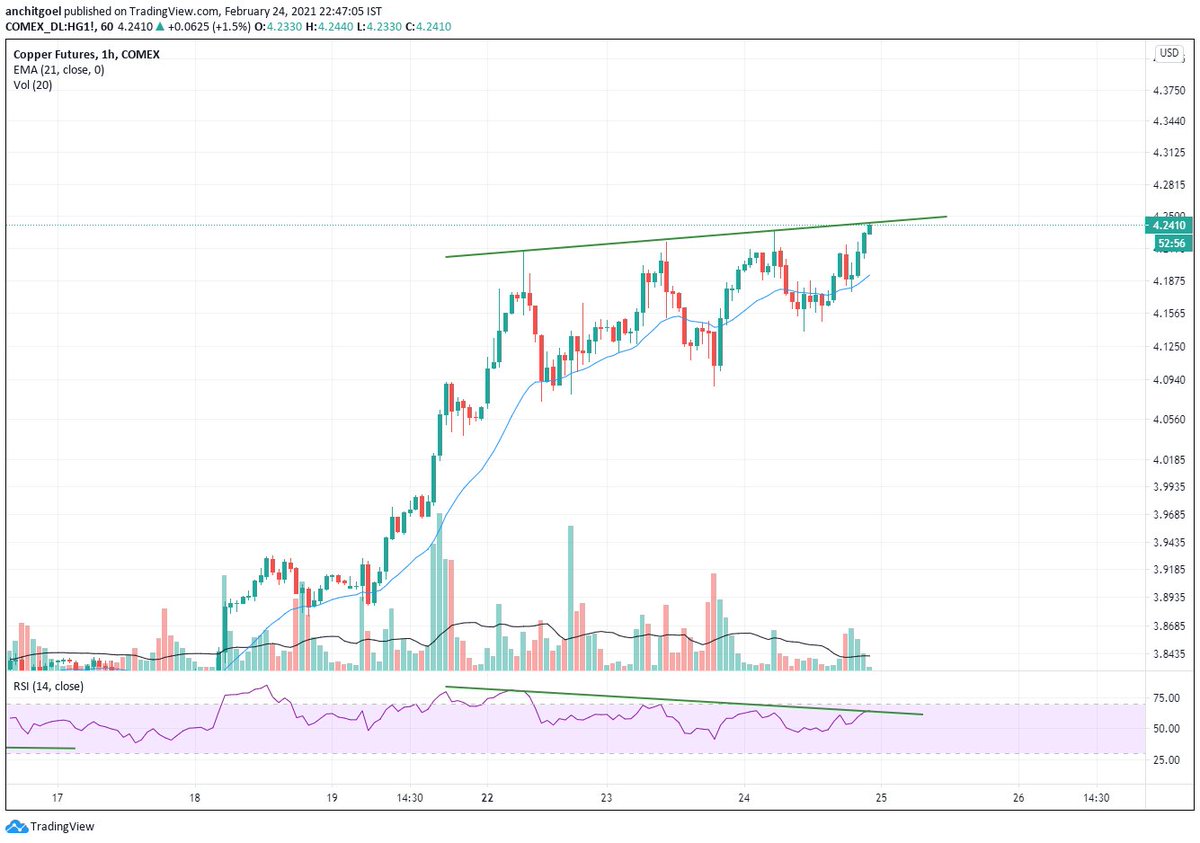
#HindCopper
— Anchit Goel (@anchitsays) February 23, 2021
20% Upper Circuit at 118.05 now!! \U0001f389\U0001fa85\U0001f525\U0001f680\U0001f973\U0001f37b\U0001f60d
Conviction and patience has given excellent results. https://t.co/T5y2CBY9Lt pic.twitter.com/xvDeR91PkL
Sir can u please make a video on how to get this plotted in trading view .Please sir .a small guidance will be highly appreciated .I know there are many like me who don't know to plot it but are shy to admit .it would benefit them too .thank u sir
— rajesh shetty (@shettyrajeshs) May 4, 2021