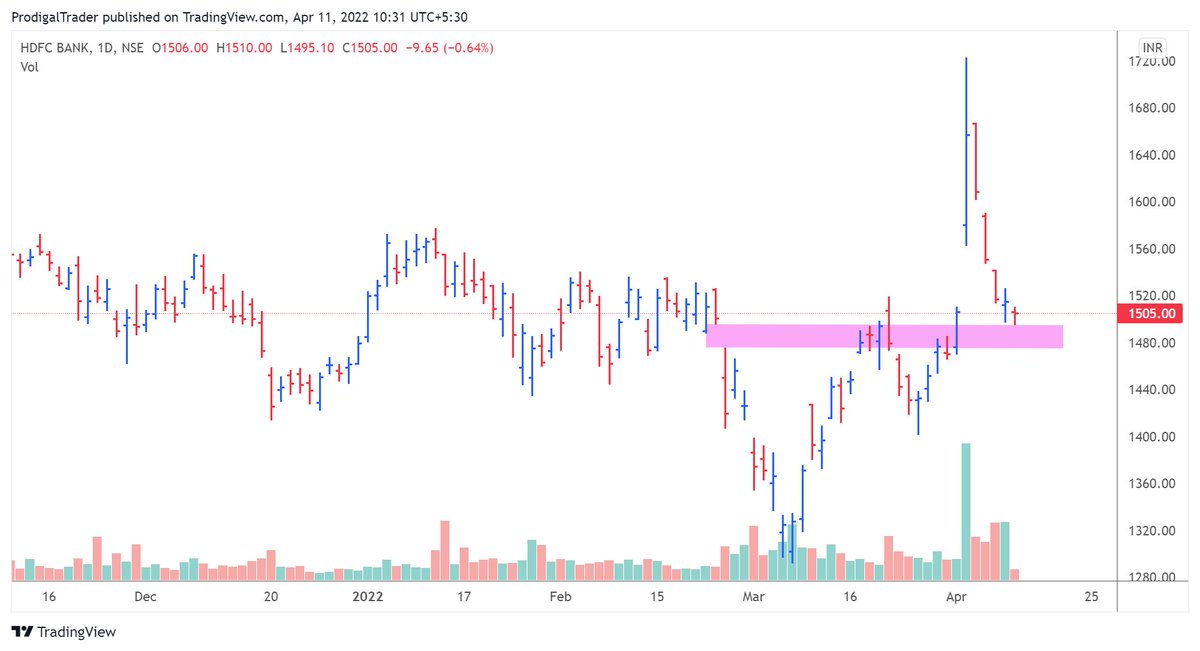
Price very much likely to bounce off here. Price is auctioning around an area where high and agressive bids could come in
#hdfcbank #hdfcamc
More from Aneesh Philomina Antony (ProdigalTrader)


More from Hdfcbank


You May Also Like


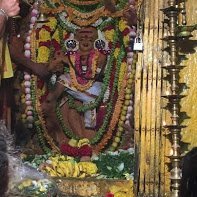
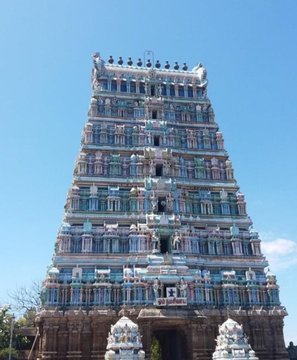
Margatha Natarajar murthi - Uthirakosamangai temple near Ramanathapuram,TN
#ArudraDarisanam
Unique Natarajar made of emerlad is abt 6 feet tall.
It is always covered with sandal paste.Only on Thriuvadhirai Star in month Margazhi-Nataraja can be worshipped without sandal paste.
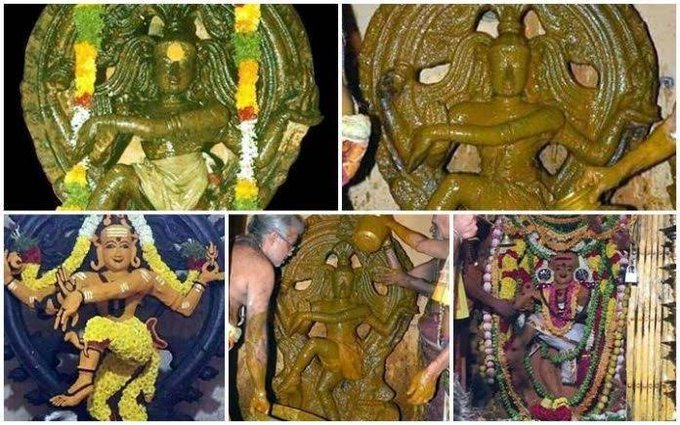
After removing the sandal paste,day long rituals & various abhishekam will be https://t.co/e1Ye8DrNWb day Maragatha Nataraja sannandhi will be closed after anointing the murthi with fresh sandal paste.Maragatha Natarajar is covered with sandal paste throughout the year
as Emerald has scientific property of its molecules getting disturbed when exposed to light/water/sound.This is an ancient Shiva temple considered to be 3000 years old -believed to be where Bhagwan Shiva gave Veda gyaana to Parvati Devi.This temple has some stunning sculptures.
#ArudraDarisanam
Unique Natarajar made of emerlad is abt 6 feet tall.
It is always covered with sandal paste.Only on Thriuvadhirai Star in month Margazhi-Nataraja can be worshipped without sandal paste.
After removing the sandal paste,day long rituals & various abhishekam will be https://t.co/e1Ye8DrNWb day Maragatha Nataraja sannandhi will be closed after anointing the murthi with fresh sandal paste.Maragatha Natarajar is covered with sandal paste throughout the year
as Emerald has scientific property of its molecules getting disturbed when exposed to light/water/sound.This is an ancient Shiva temple considered to be 3000 years old -believed to be where Bhagwan Shiva gave Veda gyaana to Parvati Devi.This temple has some stunning sculptures.