More from Trader knight


A mega thread, this contains some of my popular threads which may help you in your trading.
Thanks for reading :)

Pyramiding
Don't change your trading
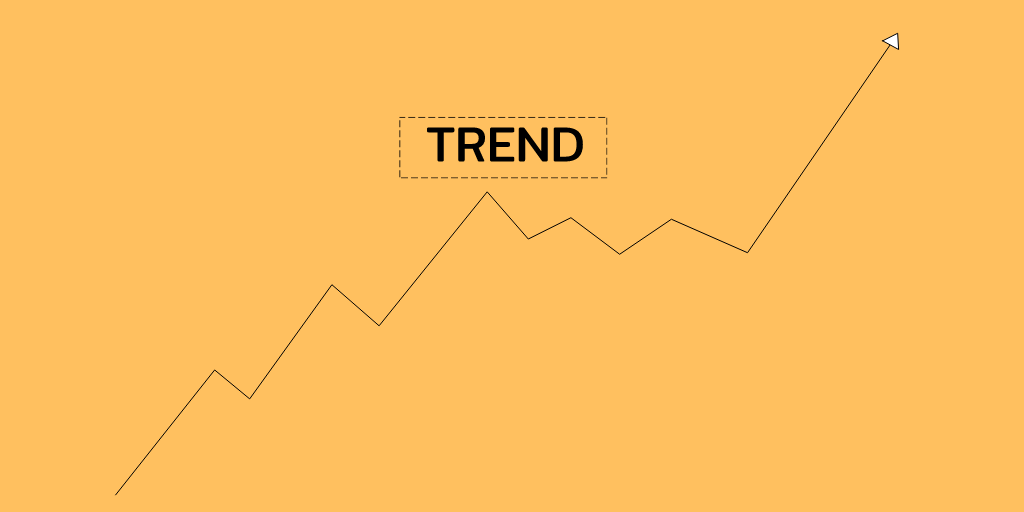
Trendlines
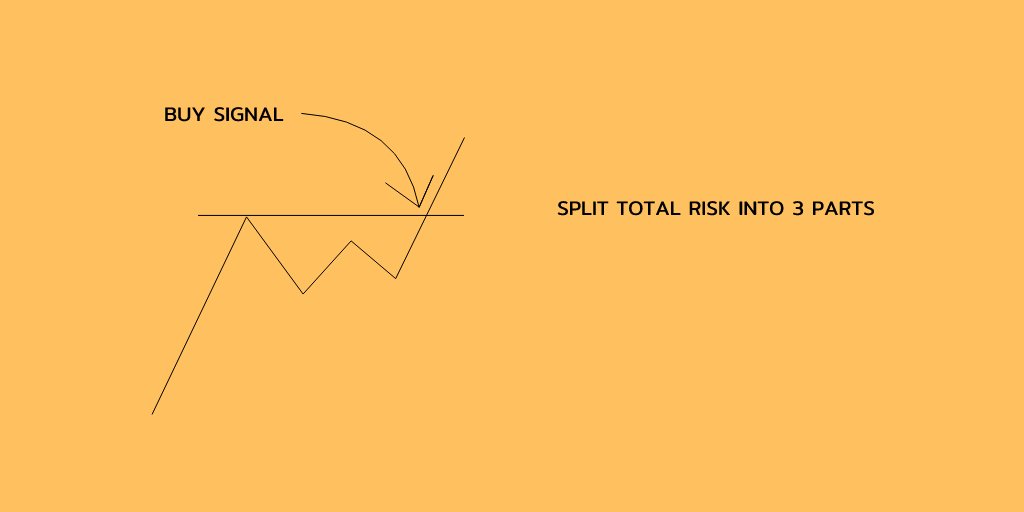
Scaling in-out
Thanks for reading :)
Pyramiding
A thread on Pyramiding- pic.twitter.com/8EOSSFMZ2w
— Trader knight (@Traderknight007) December 27, 2020
Don't change your trading
"Don't change the trading rules after every trade."
— Trader knight (@Traderknight007) November 29, 2020
If you do change them frequently then this thread is for you.
Let's talk about the law of large numbers and how it benefits traders to be profitable.
[Thread]\U0001f447\U0001f447\U0001f447 pic.twitter.com/pEUr0wH354
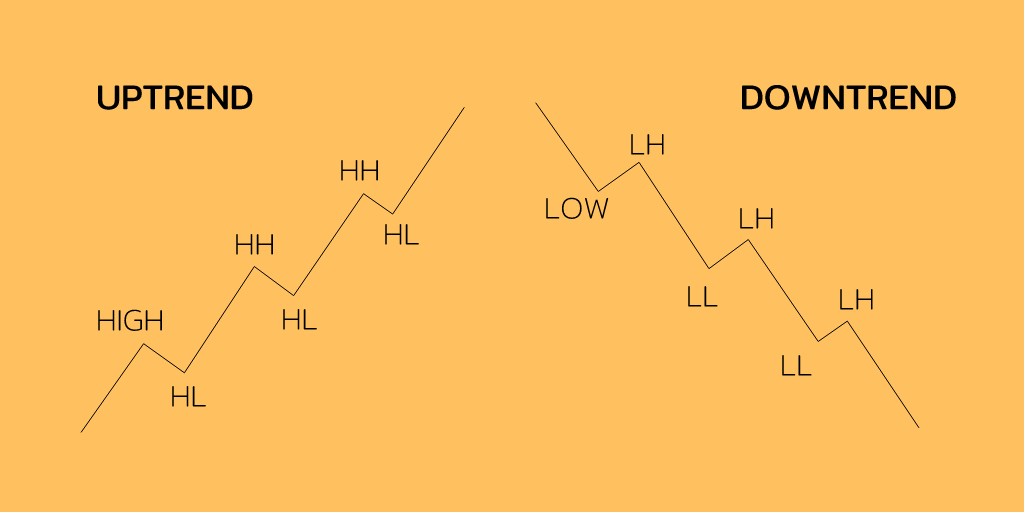
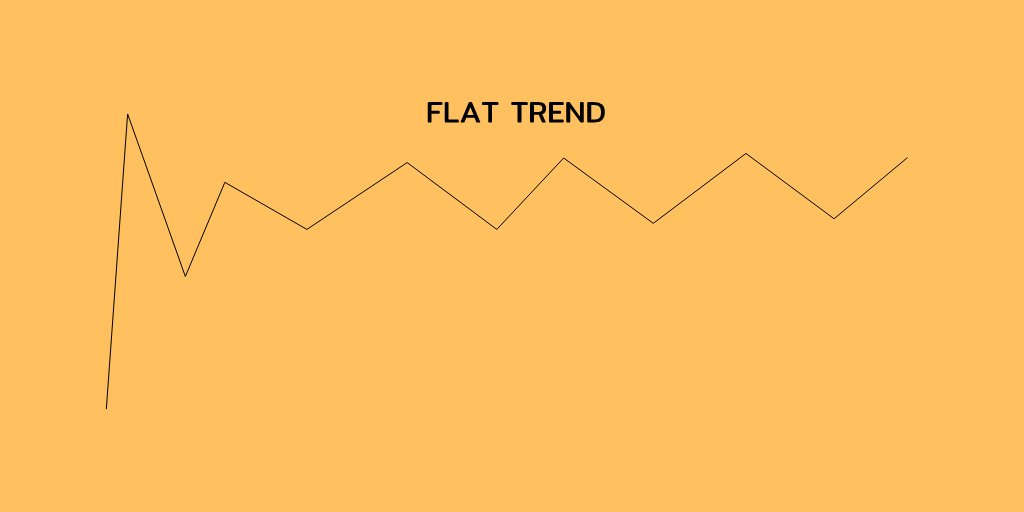
Trendlines
A thread on Trend-lines pic.twitter.com/GsLGzl8A3c
— Trader knight (@Traderknight007) January 2, 2021
Scaling in-out
A thread on SCALING IN - OUT METHOD - pic.twitter.com/bJ1N5ZjAiK
— Trader knight (@Traderknight007) January 9, 2021
More from Stockslearnings


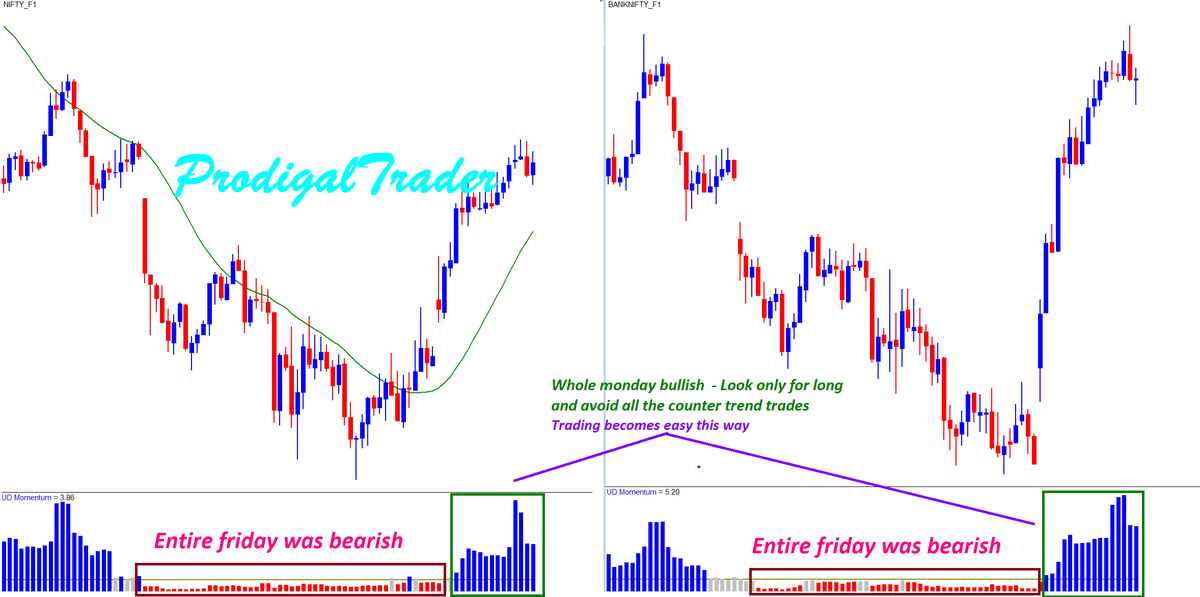
I have explained the importance of meeasuring momentum of the trend.
U can guage the strength in the trend once u know how to measure the direction.
This trend strength is infact signals the trend continuity or the potetnial for sustanining the trend.
Thats great assurace to hav https://t.co/HanLvlXkjQ
U can guage the strength in the trend once u know how to measure the direction.
This trend strength is infact signals the trend continuity or the potetnial for sustanining the trend.
Thats great assurace to hav https://t.co/HanLvlXkjQ
Before making ur trade entry or even before making a bias of trend as either bullish or bearish, do u use any objective measures to define the trend based on price, volume and momentum?
— Aneesh Philomina Antony (@ProdigalTrader) May 15, 2021
Price will always go back and forth move no matter how strong the trend is.
1/4 pic.twitter.com/qqizh2JO3J