This screener will help you in finding out breakout in stocks for intraday.
https://t.co/5iZnliL7ge
Trading on chart patterns is difficult, Until you see this:
— The Chartians (@chartians) August 6, 2022
Free Technical Analysis course (1/10) \U0001f9f5
Trading on chart patterns is difficult, Until you read this ! \u26a1\ufe0f
— The Chartians (@chartians) August 21, 2022
Everything about Cup and Handle Pattern
Free Technical Analysis course (2/10) \U0001f9f5
Trading on chart patterns is difficult until you read this !\u26a1\ufe0f
— The Chartians (@chartians) August 28, 2022
Everything about Ascending Triangle Pattern
Free Technical Analysis course (3/10) \U0001f9f5
Trading on chart patterns is difficult, Until you read this ! \u26a1\ufe0f
— The Chartians (@chartians) October 9, 2022
Everything about Head and Shoulder Pattern
Free Technical Analysis course (4/10) \U0001f9f5
Price Action Trading ( Without Indicators)
— Learn to Trade (@learntotrade365) August 20, 2022
Intraday Trading strategy for all Directional traders.
Intraday Trading Strategy Thread \U0001f9f5
Support us by RETWEET to reach and benefit maximum traders
Scroll down \U0001f447 pic.twitter.com/AVsKmWroMc
Vwap with Pivot Points
— Learn to Trade (@learntotrade365) August 14, 2022
Intraday Trading strategy for Trend followers ( Will share also for mean reversion trader as soon as possible )
Intraday Trading Strategy Thread \U0001f9f5
Support us by Retweet to reach and benefit maximum traders
Scroll down \U0001f447 pic.twitter.com/xYPPnqWQ02
Buyers vs Sellers
— Learn to Trade (@learntotrade365) August 13, 2022
A simple technique to understand the index direction using candlesticks chart.
Intraday Trading Thread \U0001f9f5
Retweet to reach & benefit maximum traders
Scroll down \U0001f447 pic.twitter.com/6vMK92EqDo

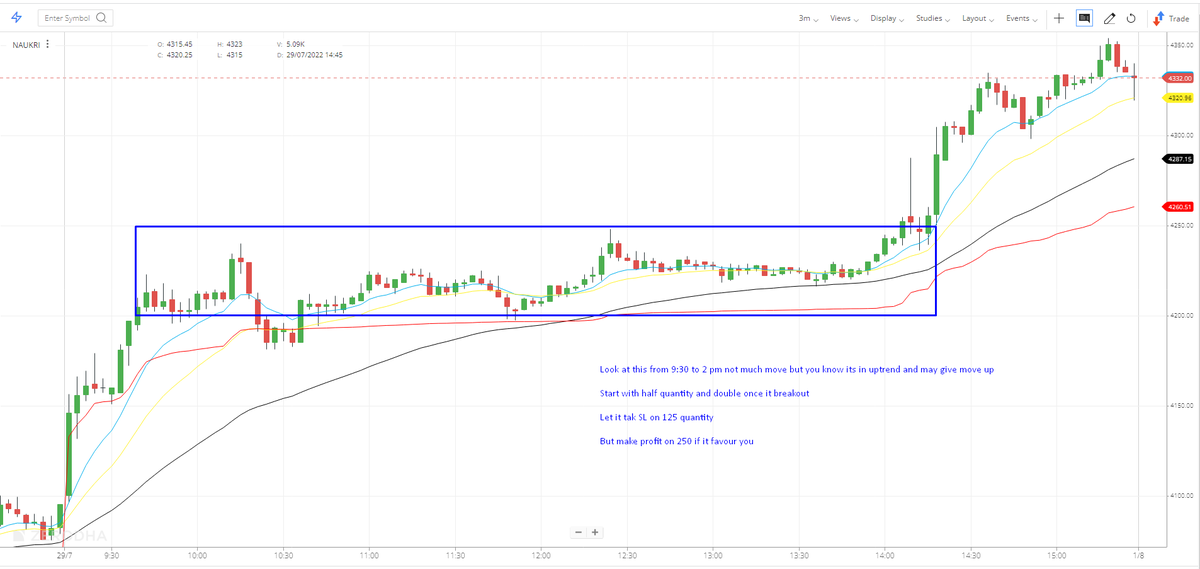
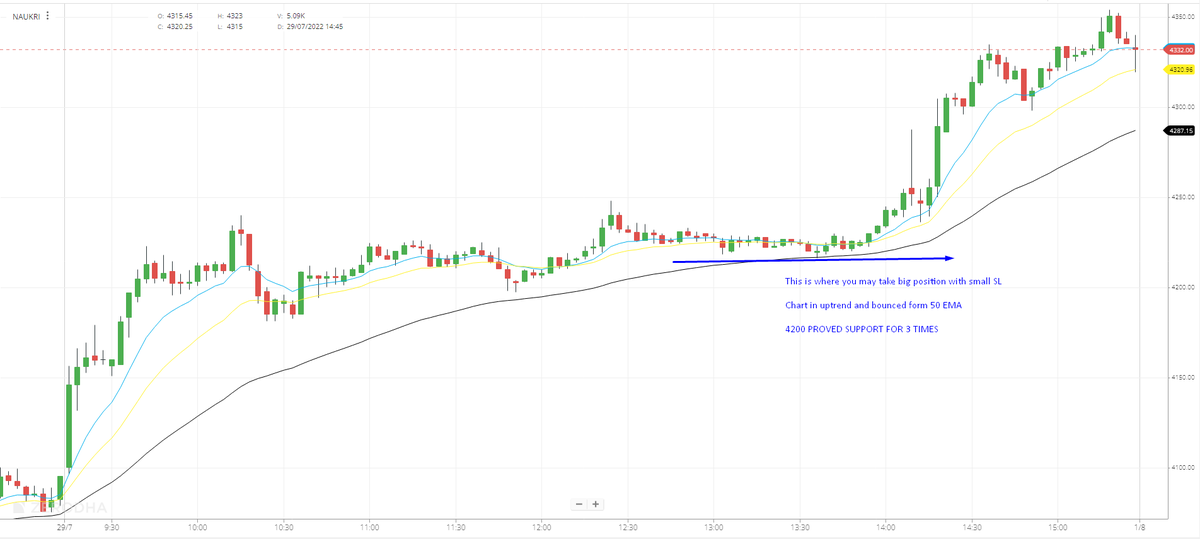
Time Frame importance -
— My First Stock (@myfirststock99) May 14, 2022
1) 3 min - For Execution
( indicators provide early signals and less reliable)
2) 15 min - to look at trend of week, Support and Resistance of last 4-5 days
3) Daily - to check current trend and Short Term S-R (More reliability)
Charts - pic.twitter.com/SWHcQQ8m0F