You might be using chart patterns incorrectly if you've not seen this.

Data says 81% of people trade these patterns incorrectly, and you might be one of them.

Read now or regret later:: A complete guide on Top 5 chart patterns in this thread 🧵:

1/ Rounding Bottom:

Rounding Bottom or U Pattern or Saucer all are one and the same with different names and it is a bullish pattern.

https://t.co/tkKlHF4ebE
2/ Cup and Handle:

A bullish technical pattern that is very popular in Technical Analysis.

https://t.co/EsT0ZFj2L5
3/ Ascending Triangle:

Ascending triangle is created by price moves that allow for a horizontal line to be drawn along the swing highs and a rising trendline to be drawn along the swing lows.

https://t.co/b9oCYrfbpJ
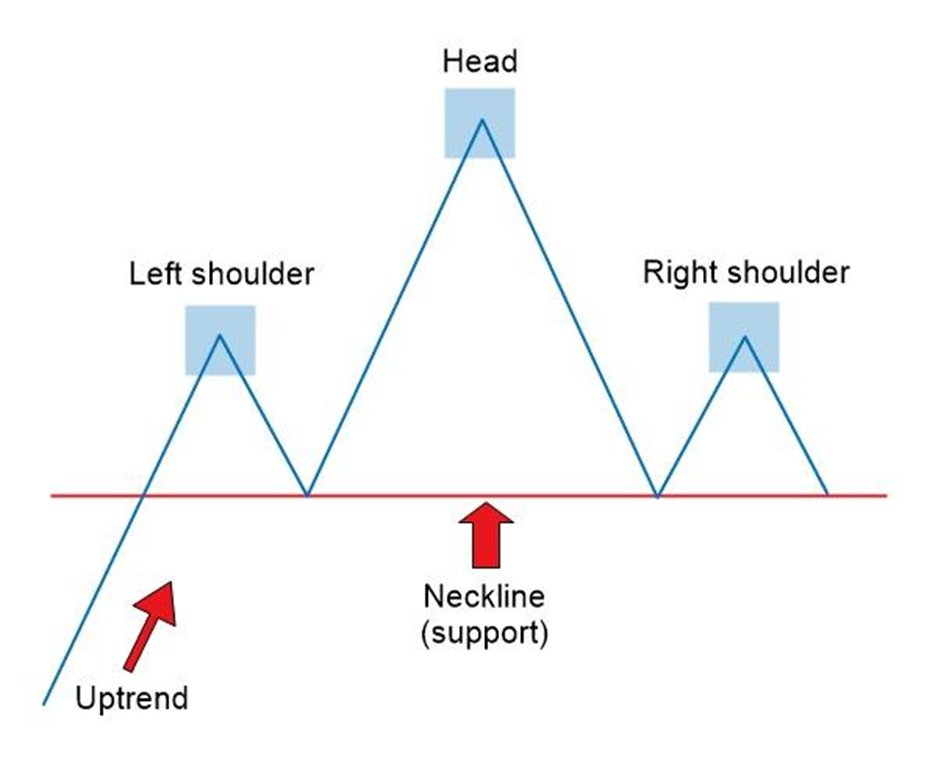
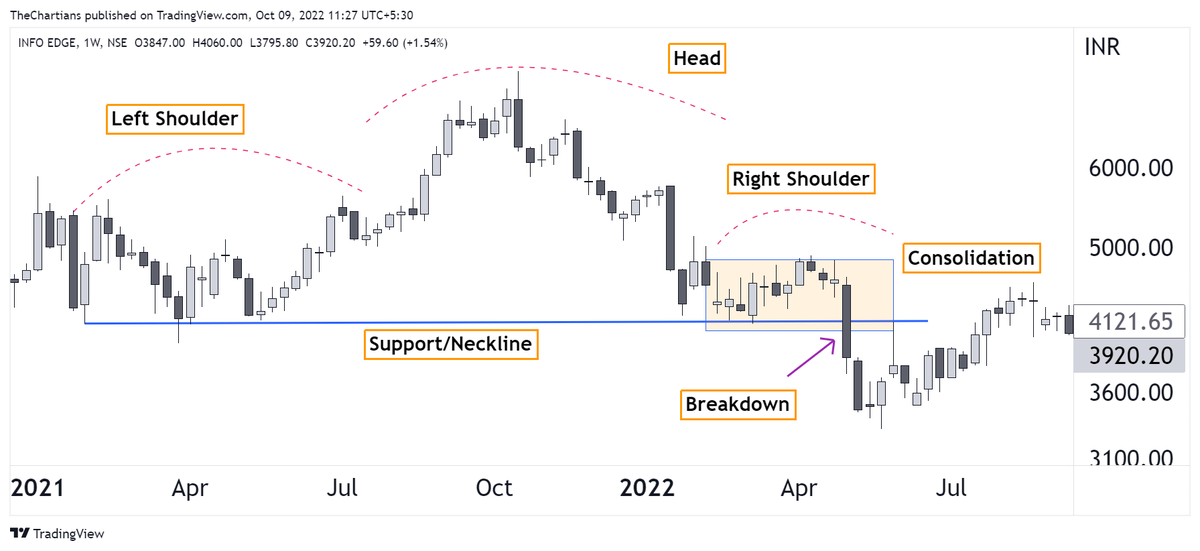
4/ Head and Shoulder Pattern:

It is one of several top patterns that signal an upward trend is nearing its end.

https://t.co/Irzhh2QMTH
5/ Inverse Head and Shoulder Pattern:

It is a bullish pattern and may be used to predict reversals in downtrends.

https://t.co/WyuQstl4Q0
These are the top 5 chart patterns that is widely used in Technical Analysis.

If you found this useful, please RT the first tweet.

Also, for stock and option trades, you can join our Telegram Channel ⤵️

https://t.co/FSyDMaYePf

More from The Chartians

More from Catagory trading

Option Buying Simplified (PART -2)

Very important thread for all option buyers 🧵

Just 5 to 10 minutes to read but it can change your trading a lot.

Support us by RETWEET this tweet to help more option buyers to gain knowledge & to avoid getting trapped from big players https://t.co/yBZ6Y7BaGx


I do Intraday Live Market session via Youtube Live on all trading days - Follow us on twitter @learntotrade365

Join the Telegram channel for Live Market updates and more free content.

Scroll down

Main problem which most option buyers face is Option Premium erosion ( Theta Decay ). So I have shared a simple & effective process to understand the option decay during Live Market before entering option buying trades

Scroll down 👇


Follow up example from the above chart about Option premium decay during sideways market. In general most option premium erosion (theta decay) happens during sideways market.

Theta is option buyers ENEMY

Scroll down 👇


Option Buyers high probability zones while trading ATM & ITM strike prices.

VWAP helps a lot in providing data during Live Market

Scroll down 👇
7 Screener Ideas for Intraday Buying

A Thread 🧵🧵

Tested - Executed in Real - Works

Kindly Re-Tweet for Max Reach 🙏🙏

1) Buy a Gainer when bounce from VWAP

Condition apply to chart ink -

- Stock days' gain > 1%
- Candle Low < VWAP and Close > VWAP
- Now check chart manually

You will get list of stocks that are gainers and consolidated to bounce from VWAP

https://t.co/W7HVmFvYpy


2) Near Day High

- Top gainers make 3-4 times new High in a day
- Best to enter when it break High of one wave
- Check charts manually after you get list

This screener gives you stocks that are near day High

Apply this with Time frame 3 or 15 min -

https://t.co/ocM7Whvtdi


3) Stocks at Resistance -

Conditions to apply -

- Stock day's gain > 1%
- High of Last 3-4 candles is equal

Apply like this -


4) Bullish Engulfing -

Very Good Signal for Intraday buying any time frame

Here is the screener -

Change Time frame according to

You May Also Like