Technical analysis screeners which will just take 5 minutes to find good looking stocks out of 5000+ stocks!

✅ Intraday Breakout Trading
✅ Volatility Contraction
✅ Candlestick Pattern

A Thread 🧵👇
Do save it and Retweet to help us educate more beginner traders and others!

(1) Near day high

Use 5 & 15 minutes time frame for intraday trading for doing breakout trading.

Intraday bullish Breaking trading screens!👇
https://t.co/5RDSrc5yuH
(2) Intraday 15 minutes Breakout

My favourite one for intraday!👇

https://t.co/oaNZB1BqUM
(3) Volatility contraction

This is for swing trading!
Swing Trading Bullish Screener

https://t.co/sd5lF0wGhU
(4) Bullish Engulfing

I use most of these screener for doing MTR (reversal trading).👇

https://t.co/NXl5ChrAAw
(5) Bearish Engulfing

https://t.co/4UI3xpXjuQ
(6) Bullish Piercing Pattern

https://t.co/d2fXNe81kV
(7) Bearish Dark Cloud Cover

https://t.co/uh2P5JaoXC

More from Chartmojo

More from Catagory trading

Option Buying Simplified (PART -2)

Very important thread for all option buyers 🧵

Just 5 to 10 minutes to read but it can change your trading a lot.

Support us by RETWEET this tweet to help more option buyers to gain knowledge & to avoid getting trapped from big players https://t.co/yBZ6Y7BaGx


I do Intraday Live Market session via Youtube Live on all trading days - Follow us on twitter @learntotrade365

Join the Telegram channel for Live Market updates and more free content.

Scroll down

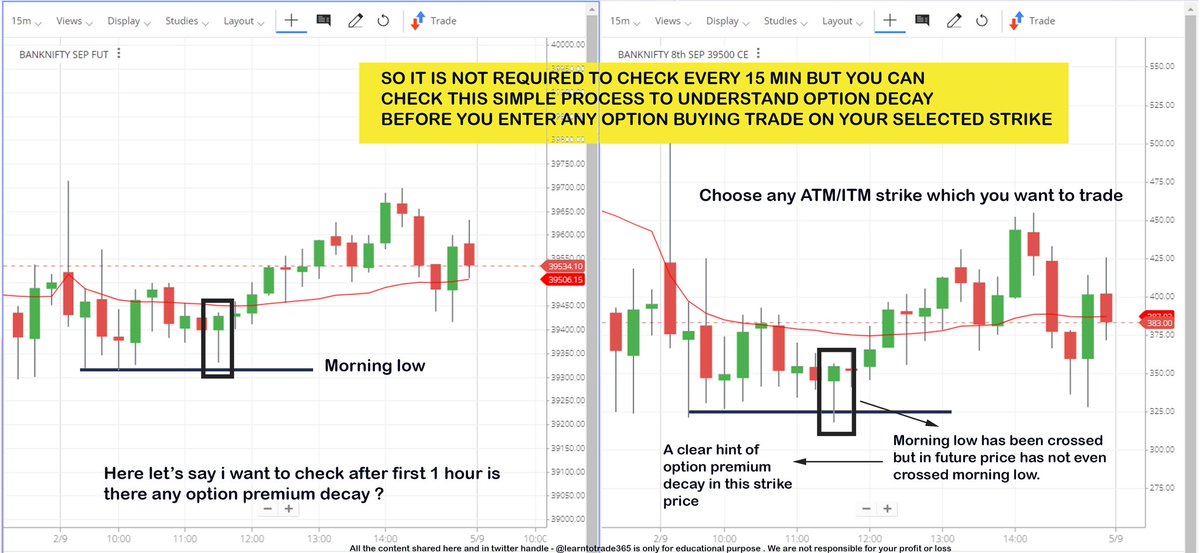
Main problem which most option buyers face is Option Premium erosion ( Theta Decay ). So I have shared a simple & effective process to understand the option decay during Live Market before entering option buying trades

Scroll down 👇


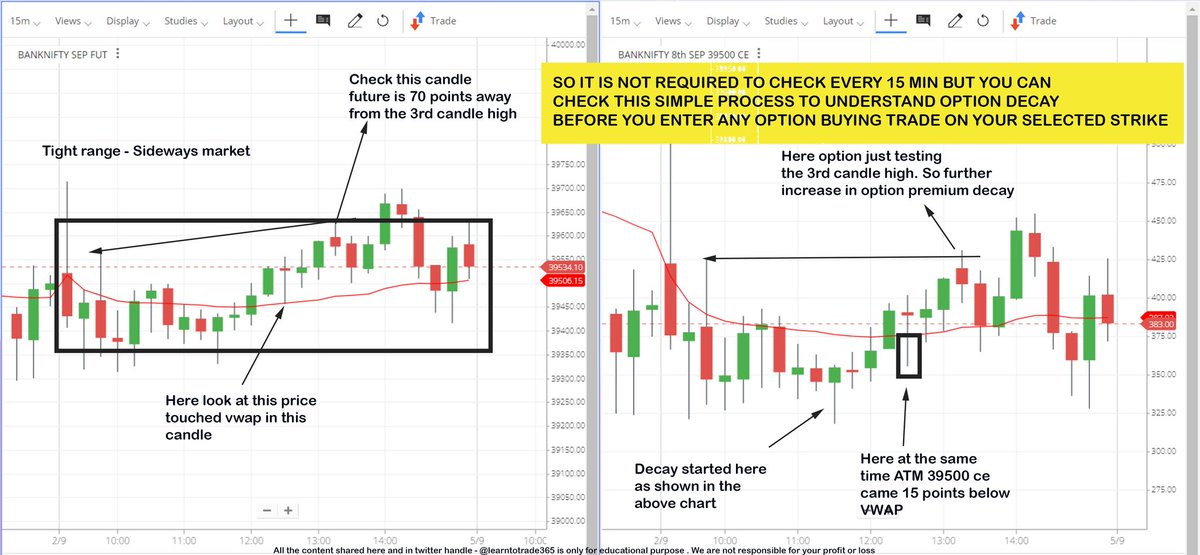
Follow up example from the above chart about Option premium decay during sideways market. In general most option premium erosion (theta decay) happens during sideways market.

Theta is option buyers ENEMY

Scroll down 👇


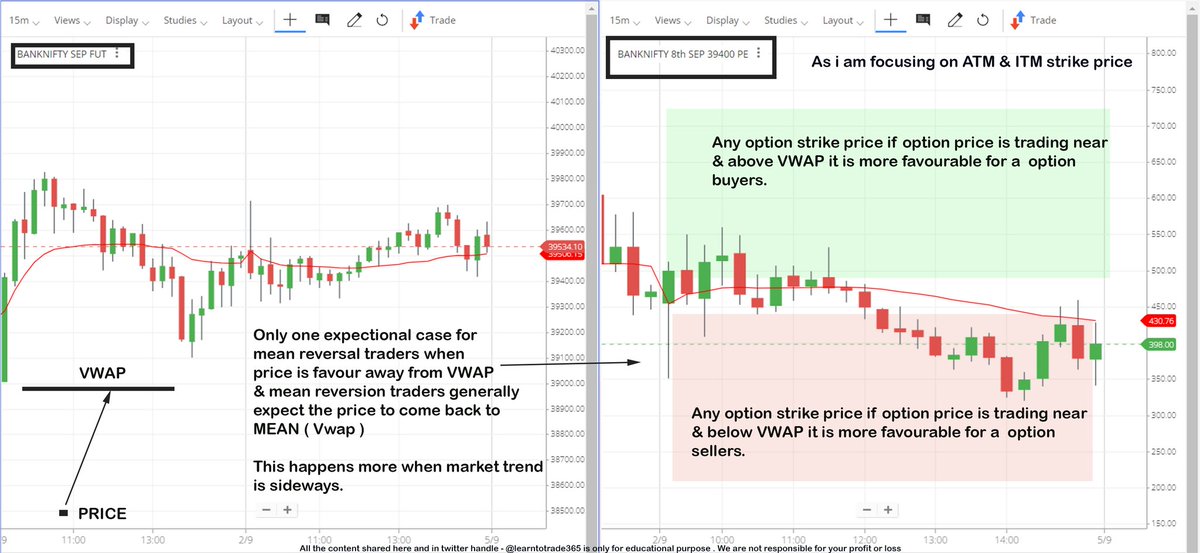
Option Buyers high probability zones while trading ATM & ITM strike prices.

VWAP helps a lot in providing data during Live Market

Scroll down 👇

You May Also Like

Trading view scanner process -

1 - open trading view in your browser and select stock scanner in left corner down side .

2 - touch the percentage% gain change ( and u can see higest gainer of today)


3. Then, start with 6% gainer to 20% gainer and look charts of everyone in daily Timeframe . (For fno selection u can choose 1% to 4% )

4. Then manually select the stocks which are going to give all time high BO or 52 high BO or already given.

5. U can also select those stocks which are going to give range breakout or already given range BO

6 . If in 15 min chart📊 any stock sustaing near BO zone or after BO then select it on your watchlist

7 . Now next day if any stock show momentum u can take trade in it with RM

This looks very easy & simple but,

U will amazed to see it's result if you follow proper risk management.

I did 4x my capital by trading in only momentum stocks.

I will keep sharing such learning thread 🧵 for you 🙏💞🙏

Keep learning / keep sharing 🙏
@AdityaTodmal