"A trendline is a line drawn on our charts that connects the swing highs and swing lows during a Trending Market."
In this thread, we'll learn about -
1. Features
2. Method to draw
3. Uses
4. Two Specific setups
5. Five crucial Tips
Features of Trendlines -
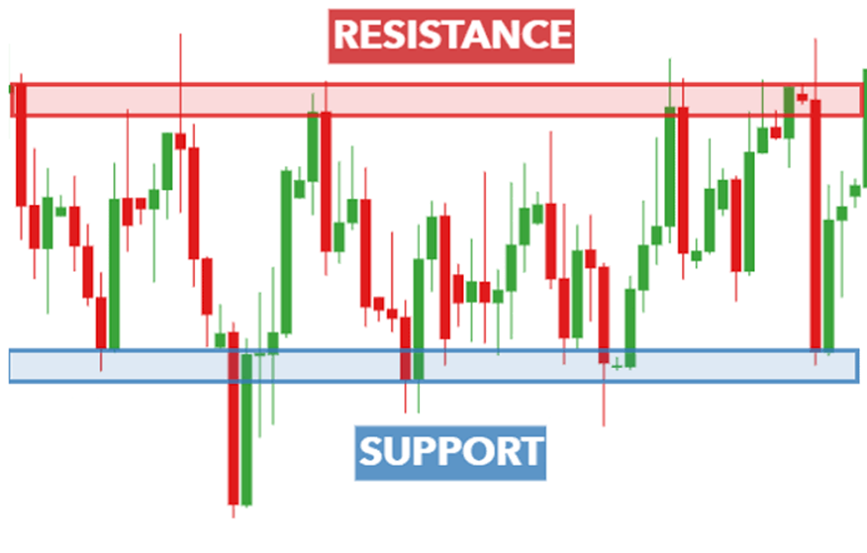
- Trendlines act as Support & Resistance (S/R).
- Break of Trendline shows a possibility of a Trend change.
- Risk : Reward is favorable when you initiate a trade from Trendlines.
How to use Trendlines
A. Use them as S/R lines and trade according to any of the Price Action strategies like Breakout, Pullback, BOF etc.
B. Use in any of these two specific Price action based setups -
1] Trend Trading
2] Reversal trading
1] Trend Trading using Trendline :-
For this, we need to learn about "Area of High Confluence" -
They are ...
... the areas where Trendline and Support or Resistance line cross each other.
A lot of traders have their eyes on it. High probability that they will start action here, causing the development of a new trend.
Set up for Trend Trading using Trendline -
1. There should be the presence of a larger ongoing trend in bigger TF, draw a trendline for that.
2. There should be the development of an immediate trend in smaller TF, draw trendlines for that one too.
3. When the price touches the area of high confluence, draw a trendline below the Immediate trend.
4. Once this trendline breaks, take entry.
This setup will be clear by the following example -
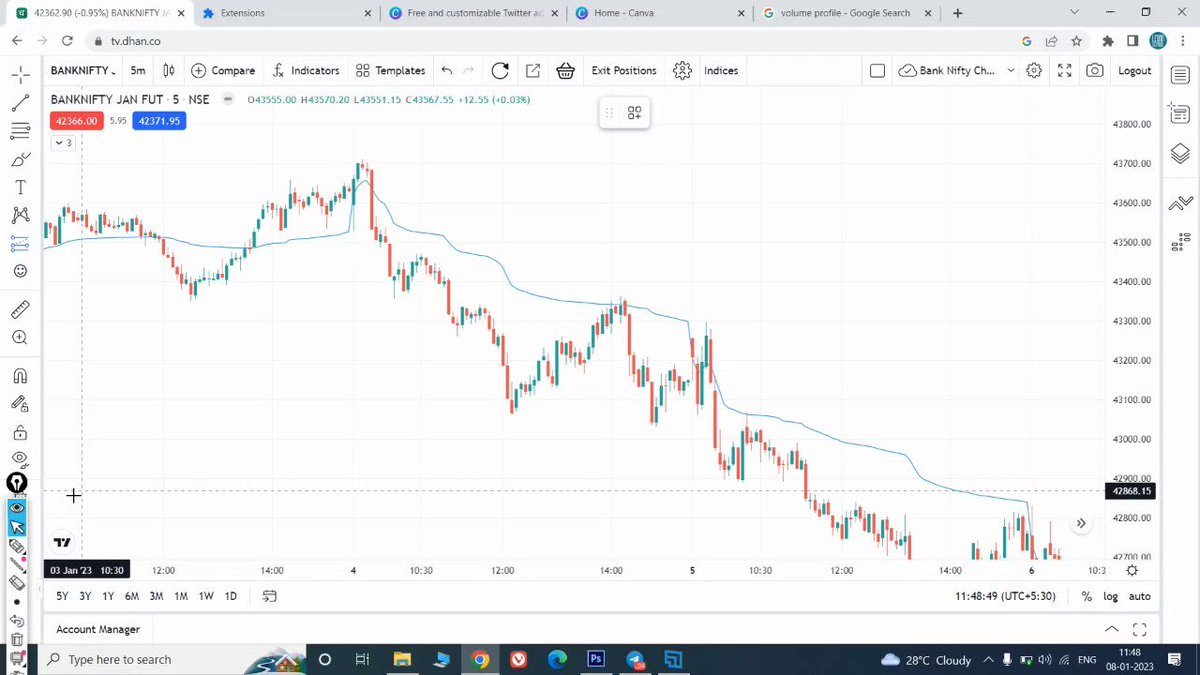
a) In these images, you can see the larger ongoing downtrend.
We drew the Trendlines containing the peaks for this trend.
b) As you can see in this image, there is presence of an Area of High Confluence where both the Downside trendline & Horizontal S/R lines meet.
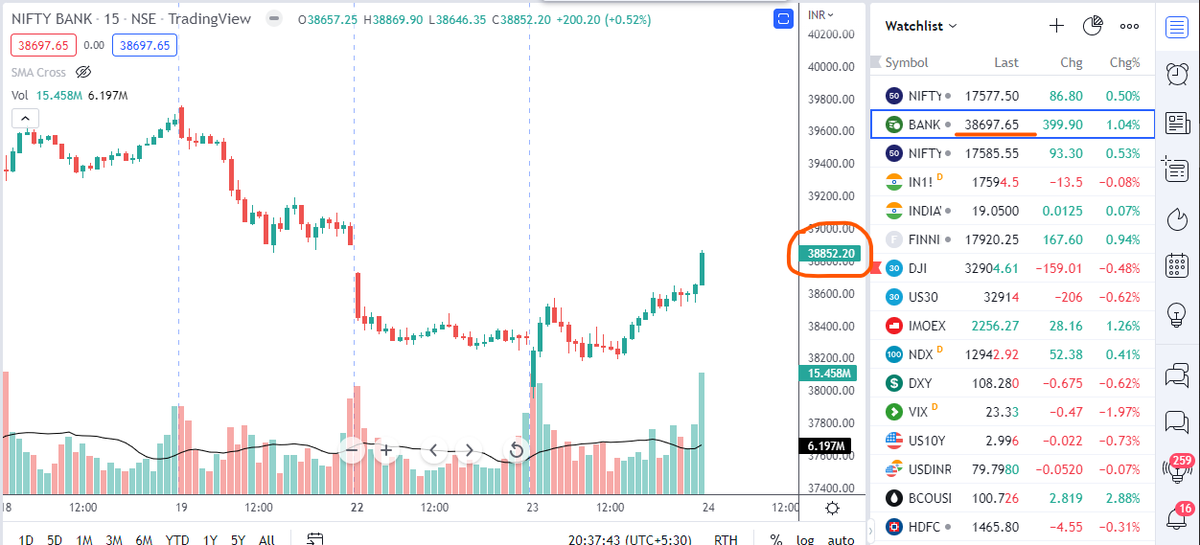
c) Now in these images, you can see the development of an uptrend in smaller TF.
When this uptrend touched the Area of High Confluence, we've drawn trendlines below this.
d) You can see this line diagram chart to get more clarity.
e) Now when price again broke the smaller trend's trendline, it was time for us to take entry.
You can see the Risk was very small making the R:R quite high.
Now let's discuss the second specific scenario,
2] Reversal trading using Trendline:-
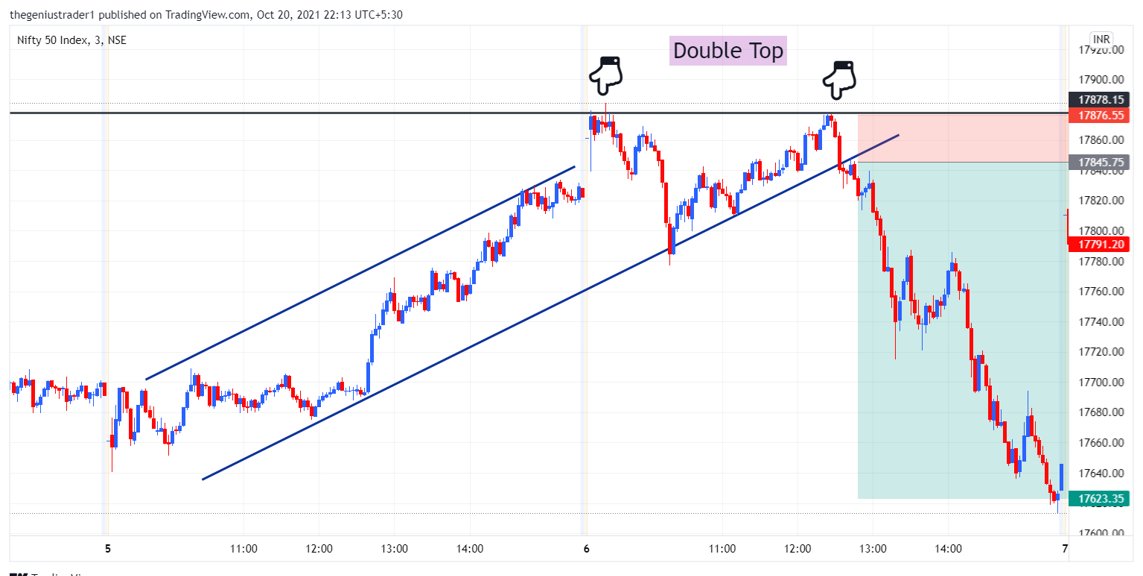
Look for Double Top or Double Bottom formation just before a trendline breaks.
When that happens you can initiate a trade keeping the high as SL. R:R is very good in this scenario too.
See this example for more clarity -
a) The presence of Uptrend was there, we've drawn trendlines for that.
b) Double top formation occurred.
c) When the price broke the lower Trendline, we initiated a trade with good R:R.
Now the question arises.. How to draw the Trendlines??
I will DM you the "Accurate method to draw Trendline & Five crucial Tips for trendlines" when you RETWEET the first Tweet below -
Plz make sure you follow me
@CnceptualTrader to get the DM.
https://t.co/S4nSs99Qr5
Also,
Join my Free Telegram channel at
https://t.co/rpGeR19CEy to get the PDF copy of my previous threads.
Thank you
X0X0