Join the Telegram Channel for live market updates & live market sessions
https://t.co/VU0bCGjmhU
Scroll down👇

MEGA LEARNING THREAD
— Learn to Trade (@learntotrade365) August 27, 2022
The thread contain all the FREE CONTENT which I have shared so far.
Everyone support us by RETWEET & LIKE so it can reach wider and benefit many traders.
YouTube channel - https://t.co/pUUwDN7IO5
Telegram channel - https://t.co/VU0bCGjU7s pic.twitter.com/f0Uf7ech31
Price Action Trading ( Without Indicators)
— Learn to Trade (@learntotrade365) August 20, 2022
Intraday Trading strategy for all Directional traders.
Intraday Trading Strategy Thread \U0001f9f5
Support us by RETWEET to reach and benefit maximum traders
Scroll down \U0001f447 pic.twitter.com/AVsKmWroMc
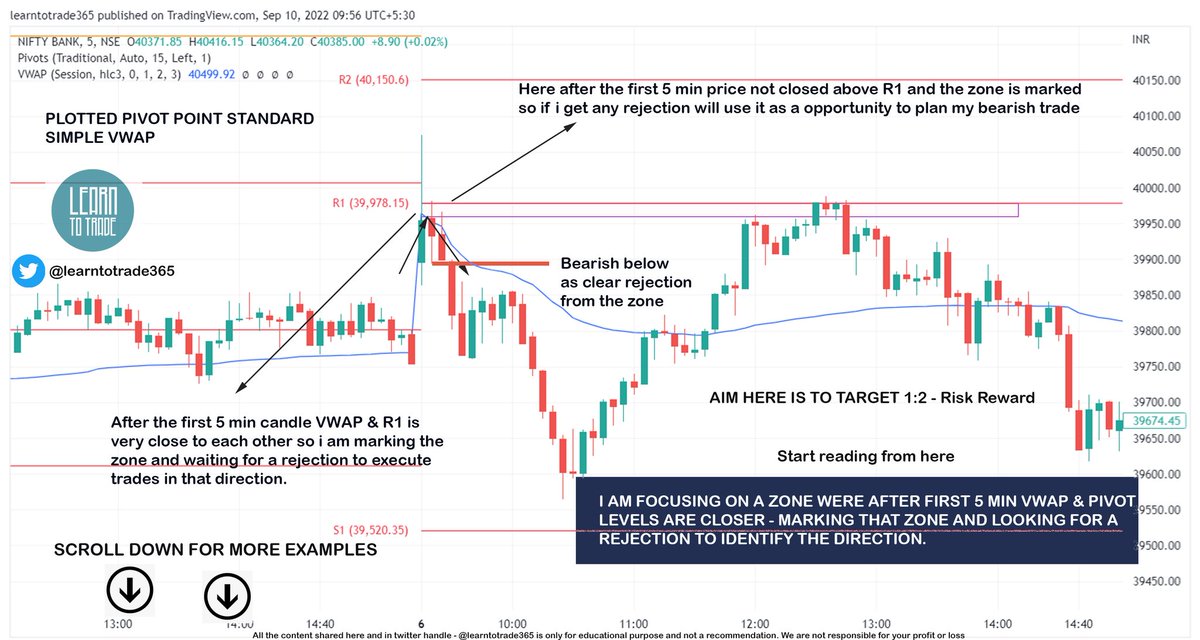
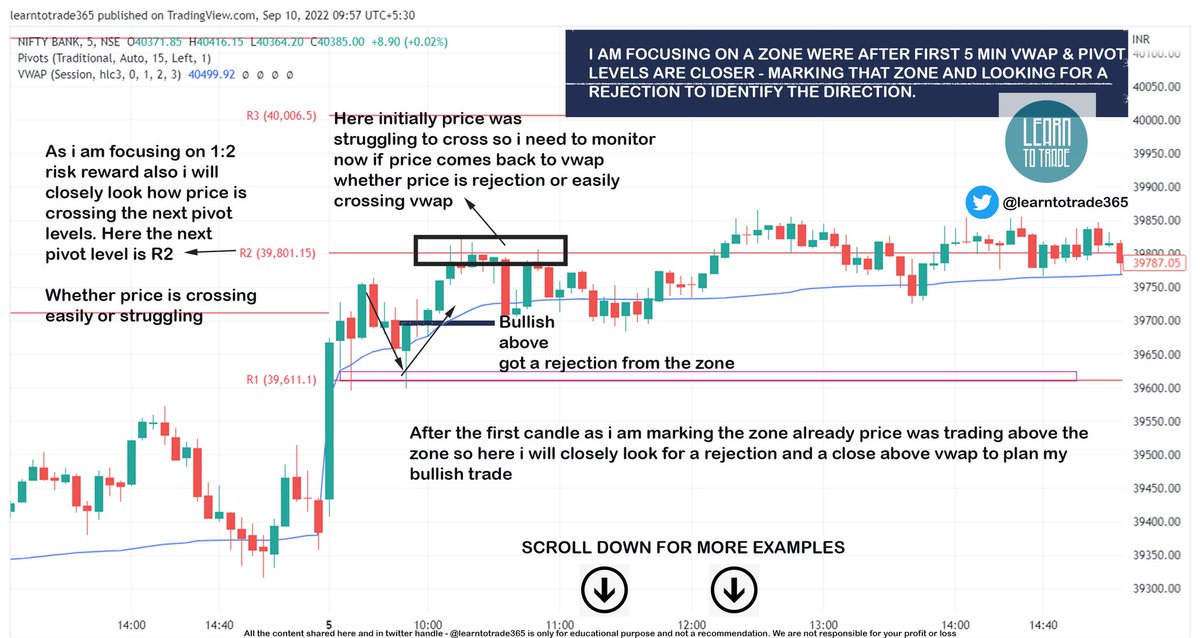
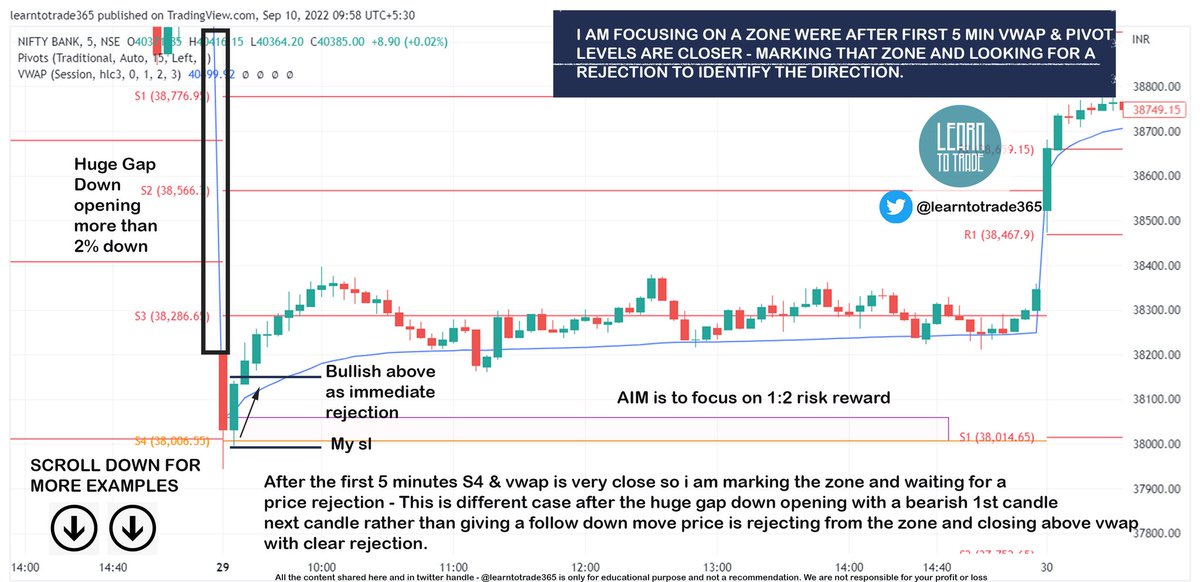
Vwap with Pivot Points
— Learn to Trade (@learntotrade365) August 14, 2022
Intraday Trading strategy for Trend followers ( Will share also for mean reversion trader as soon as possible )
Intraday Trading Strategy Thread \U0001f9f5
Support us by Retweet to reach and benefit maximum traders
Scroll down \U0001f447 pic.twitter.com/xYPPnqWQ02
Buyers vs Sellers
— Learn to Trade (@learntotrade365) August 13, 2022
A simple technique to understand the index direction using candlesticks chart.
Intraday Trading Thread \U0001f9f5
Retweet to reach & benefit maximum traders
Scroll down \U0001f447 pic.twitter.com/6vMK92EqDo
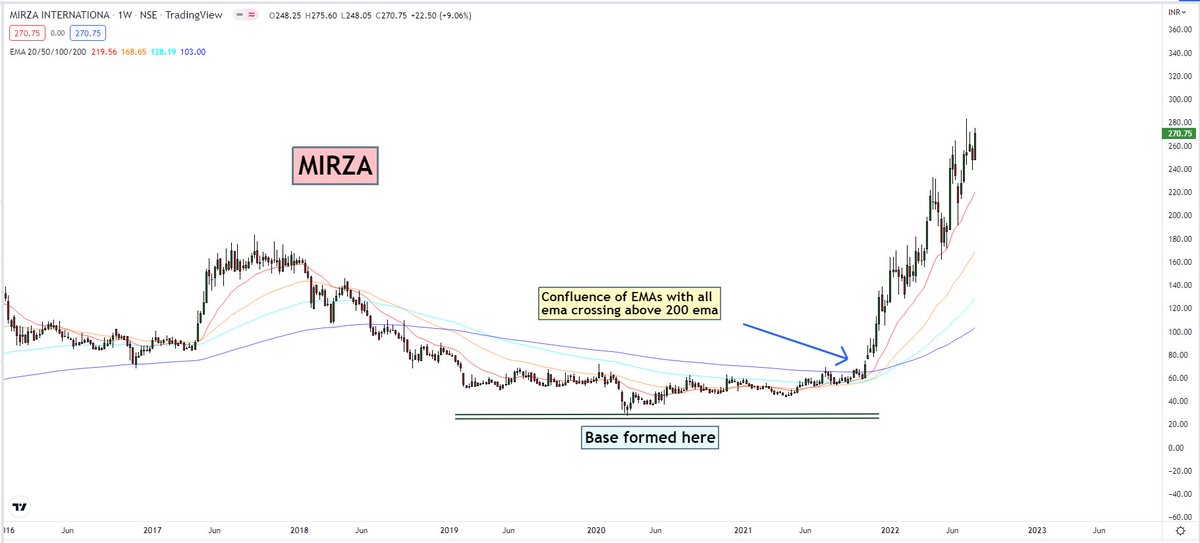
For 7 yrs I struggled to ride trends..
— Trendline Investor (@dmdsplyinvestor) April 30, 2022
& in 2015-17 when I started learning TA smthng crazy happened..
Here is a simple strategy that helped me..
\u2022 Identify turning points in stocks
\u2022 Find quality stocks
\u2022 Not panic & ride trends
\u2022 Finally make \U0001f4b8
CCI & Pivot Strategy\U0001f9f5.. pic.twitter.com/S0QFx00541
There are 1000s of indicators in Technical Analysis...
— Trendline Investor (@dmdsplyinvestor) May 12, 2022
But you need to MASTER ONLY ONE\U0001f3afto win in markets...
I selected 'Commodity channel index' (CCI) as my PRIMARY INDICATOR & all my scanners are a variation of this...
MULTI TIMEFRAME POSITIONAL STRATEGY using CCI...\U0001f9f5 pic.twitter.com/4O2PrBxSw9
My CCI based investment strategy - How does it work? A thread.
— Trendline Investor (@dmdsplyinvestor) May 23, 2020
Objective: Identify stocks that are entering a phase of momentum on the upside and ride the stock until momentum weakens.1/n
A brilliant concept based on the long term and short term EMA by @heartwon. I'm here on twitter for such stuff that helps me build my systems. Really good one. Here is the trading view indicator that I coded. Please RT for everyone's benefit. 1/3 https://t.co/uleWiysyL1
— Trendline Investor (@dmdsplyinvestor) July 5, 2020
Trading on chart patterns is difficult, Until you see this:
— The Chartians (@chartians) August 6, 2022
Free Technical Analysis course (1/10) \U0001f9f5
Trading on chart patterns is difficult, Until you read this ! \u26a1\ufe0f
— The Chartians (@chartians) August 21, 2022
Everything about Cup and Handle Pattern
Free Technical Analysis course (2/10) \U0001f9f5
Trading on chart patterns is difficult until you read this !\u26a1\ufe0f
— The Chartians (@chartians) August 28, 2022
Everything about Ascending Triangle Pattern
Free Technical Analysis course (3/10) \U0001f9f5
Trading on chart patterns is difficult, Until you read this ! \u26a1\ufe0f
— The Chartians (@chartians) October 9, 2022
Everything about Head and Shoulder Pattern
Free Technical Analysis course (4/10) \U0001f9f5