The Ultimate Guide to ‘RELATIVE STRENGTH (RS)’...🎯

WAIT… This is NOT RSI that you use day in & out…

Rather a very IMPORTANT indicator that can CHANGE the way YOU trade/invest…🤓

So, hang on as I explain this with #TATASTEEL chart...

Let’s go 🧵…

1⃣ But, how will it change the way I trade?

- Ever wondered why the stock you are holding is not moving when the market is ripping higher?

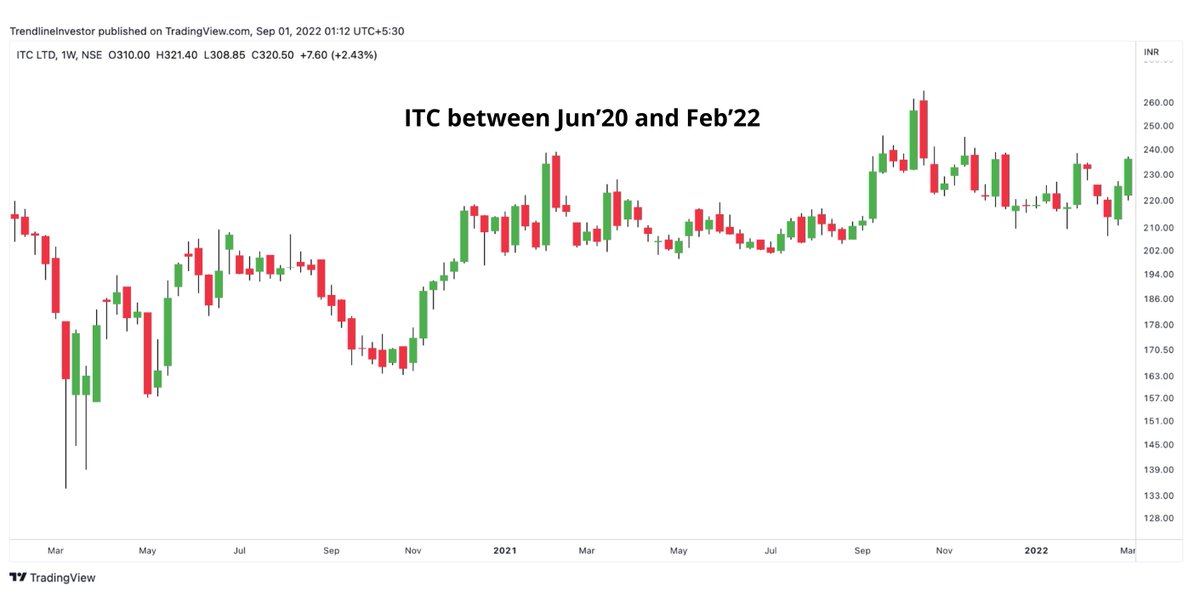
Ex: ITC didn't move btwn June’20 & Feb’22 while the market rallied

This indicator will help you get rid of such underperforming stocks.
2⃣ ok, what’s RS?

When stock A goes...

- up faster than Nifty, it is STRONG/OUTPERFORMING relative to Nifty
- down faster than Nifty, it is WEAK/UNDERPERFORMING relative to Nifty

So, RS is relative performance of a stock compared to any benchmark (refer chart for example)
3⃣ Let’s dig deeper:

A stock is outperforming/strong when

- Nifty is going up, but the stock is going up much faster than Nifty
- Nifty is going down, but the stock is going down much slower than Nifty or going up
4⃣ More definitions:

A stock is underperforming/weak when

- Nifty is going down, but the stock is going down much faster than Nifty
- Nifty is going up, but the stock is going up lesser than Nifty or going down
5⃣ Moving on to examples…

- If a stock has gone up from 100 to 500 in the last 6 months & Nifty has gone up from 10000 to 15000 in the last 6 months, then you can say the stock has gone up 5 times & Nifty has gone up only 50%.

This shows that the RS of the stock is Strong
6⃣Let's calculate RS...

- Ex: stock price @ 100 & Nifty @ 10k
- Divide the stock price/Nifty
- 100/10000=0.01
- To make it easily understandable, let’s multiply this by 100. So, 0.01*100=1.

So, this is what we did.

RS = (Stock Price/Nifty Price) * 100 = (100/10000)*100 = 1
7⃣ Time for graphs..

If you continue to do the above every day until the stock reaches 500 & Nifty reaches 15000 & if you plot it in a graph with the ratio on the y-axis & time on the x-axis, y'll notice a rising line chart

This tells you stock is clearly outperforming Nifty
8⃣ Let’s do the reverse…

If the stock is not going up as much as Nifty or if the stock is going down when Nifty is going up, then you will see a line/graph chart where the trend is down, as shown below.
9⃣Adding a 52 week MA to the RS…

- Let's add a 52 week exponential moving average(red line) of the RS that will help us understand RS trend of the last 1 yr
- The red line is much smoother & shows that the average RS was in a strong downtrend before trending up.
🔟 Let’s simply it…

- If the RS is above the 52 wk MA(red line), this signals that the RS is moving higher or the stock is outperforming Nifty.
- If the RS is below the 52 wk MA(red line), this signals that the RS is moving lower or the stock is underperforming Nifty.
1⃣1⃣ Let’s take a real example #Tatasteel...

- In the below chart, around Line 1, the price remained flat but RS kept rising - outperformance.
- Later the stock price also broke out from consolidation & started a long term uptrend that lasted for 2 long years from 2016 to 2018.
1⃣2⃣Stock starts to underperform...

- In '18 after a 2 yr strong uptrend (Line 2), RS went below the red line & the stock price also broke down from an uptrend & started heading lower.
- Since, '18 RS line has always stayed well below the red line indicating underperformance
1⃣3⃣ Tatasteel rises…

- In '20 crash (Line 3), the RS was flat while price went down to 250
- RS remained flat coz price fell lesser than Nifty
- In Nov’20 price broke the downtrend & went higher & RS crossed red line too
- Since that breakout Tatasteel has outperformed Nifty
1⃣4⃣ Uff.. too much info? 🤓

- If you stayed till here, here is the indicator code
https://t.co/olLhe4Ki2g - create a new indicator in Tradingview(TV)
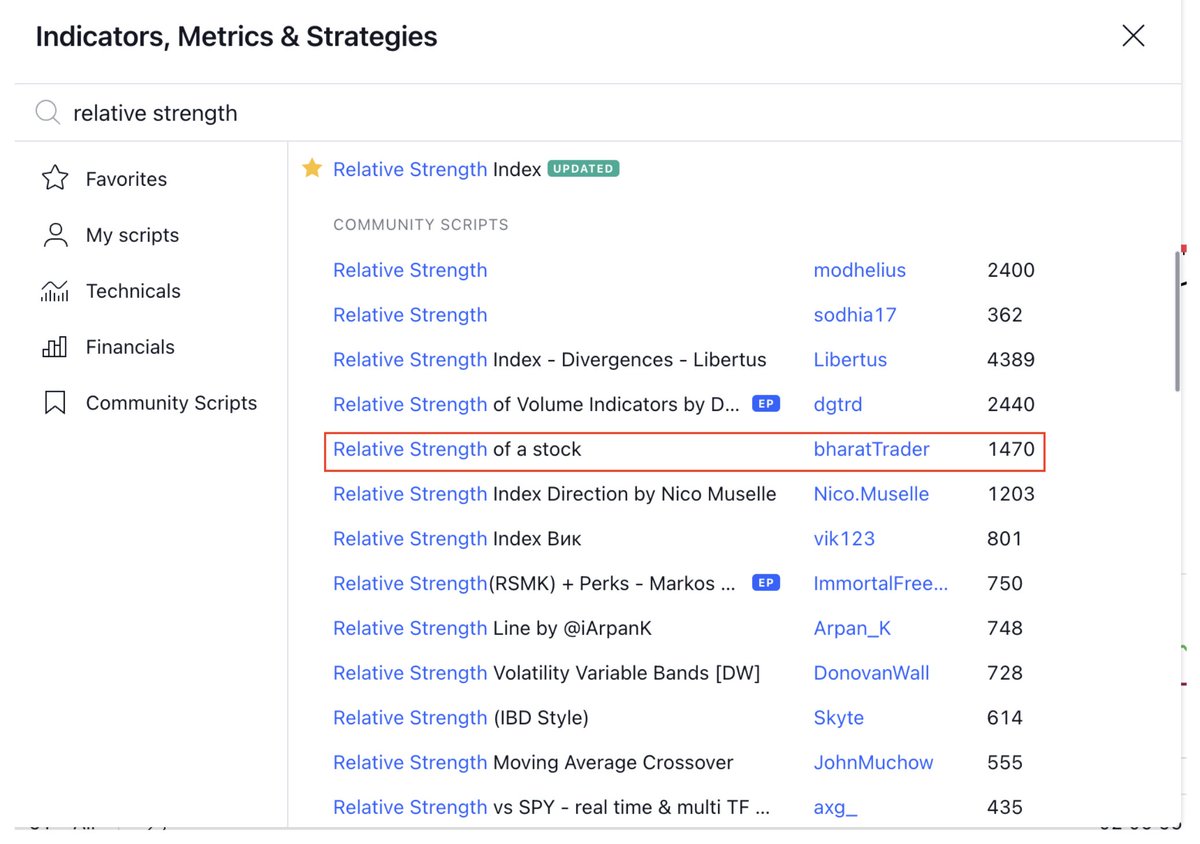
- If you don't know how to create a TV indicator then just search for this indicator in TV or just find the one that suits you
1⃣5⃣Learnt something? If yes, please👇

1. Retweet the first tweet https://t.co/cTgz3CKHaw
2. Follow @dmdsplyinvestor

3. Subscribe to my YouTube channel for more content! https://t.co/yNCTzHVRsy

More from Trendline Investor

STOCK TRADING STRATEGIES to get started today...💸

Here are 6⃣ simple strategies which you can use if you are still struggling to trade cash stocks!

They are very simple yet very effective if you can stick to them🤓

Ready to learn?

Let's go🧵...

1⃣ CCI & Pivot based strategy to ride massive trends in stocks

Don't forget to checkout the fundamental


2⃣ Multi-time frame positional strategy based on CCI with


3⃣ Only CCI based investment strategy - You can catch massive trends in stocks with good Sales/PAT growth using this


4⃣ Tradingview code for strategy shared by @heartwon based on the long term and short term

More from All

You May Also Like

1/“What would need to be true for you to….X”

Why is this the most powerful question you can ask when attempting to reach an agreement with another human being or organization?

A thread, co-written by @deanmbrody:


2/ First, “X” could be lots of things. Examples: What would need to be true for you to

- “Feel it's in our best interest for me to be CMO"
- “Feel that we’re in a good place as a company”
- “Feel that we’re on the same page”
- “Feel that we both got what we wanted from this deal

3/ Normally, we aren’t that direct. Example from startup/VC land:

Founders leave VC meetings thinking that every VC will invest, but they rarely do.

Worse over, the founders don’t know what they need to do in order to be fundable.

4/ So why should you ask the magic Q?

To get clarity.

You want to know where you stand, and what it takes to get what you want in a way that also gets them what they want.

It also holds them (mentally) accountable once the thing they need becomes true.
5/ Staying in the context of soliciting investors, the question is “what would need to be true for you to want to invest (or partner with us on this journey, etc)?”

Multiple responses to this question are likely to deliver a positive result.