LOG vs LINEAR Charting!
This is the most important thing especially if you are analysing long term charts!🧐
So, let's get this right today!
Let’s go🧵...
1⃣ Wait, What's Log chart?
Before I define Log chart, let's look at the chart you are using daily - 'The Linear Chart'
- Linear chart is used by default in most platforms. This is probably why you never knew log charts
Wait, don't click on 'log' yet before you understand it...
2⃣ ok, so what does Linear chart mean?
Take a look at the image
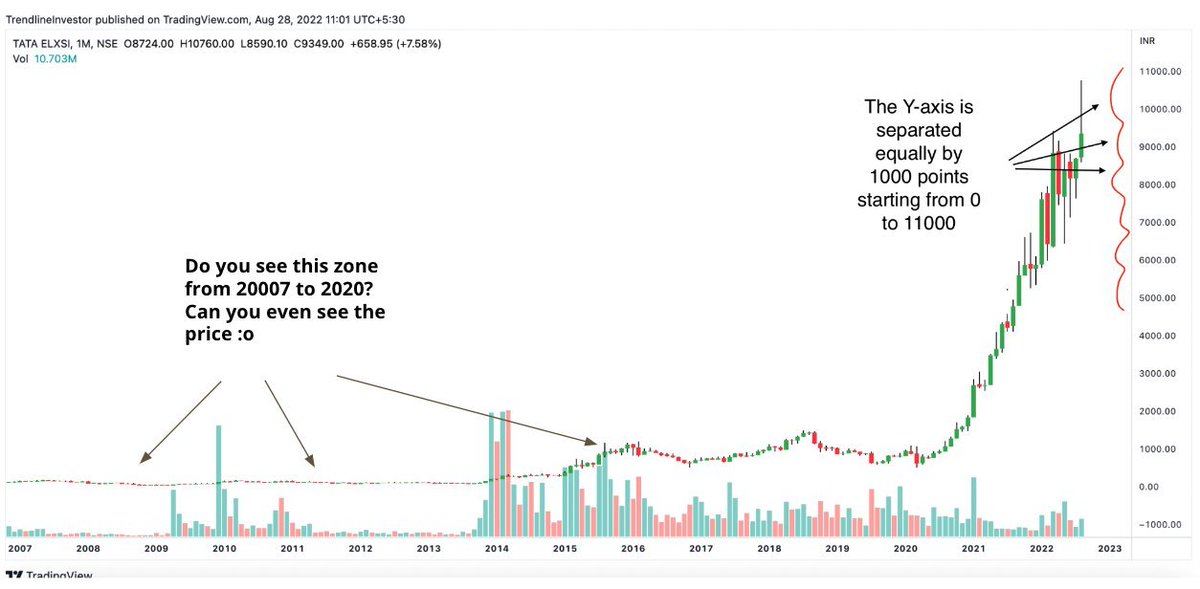
- The y-axis is separated equally by 1000 points starting from 0 to 11000.
- So, any linear chart would have its y-axis equally separated by 'N' points always
And... that's where the problem lies...
3⃣ But, I don't see any problem?🤔
Ok ok.. let me explain...
- Can you look at this #TATAELXSI chart & tell me the price in '99 when it was listed? No!
- Can you draw a proper trendline in this chart? No!
Reason is because of the price congestion between '07 to '20...
4⃣ What else?🧐
- Whenever there is a price change in an instrument & it's drastic it'd be difficult to analyse on a linear chart
- Look at this example of #BTCUSD. What happened in 2021(refer to the red box)? 🤔
All this is because of the equally spaced Y-axis!
hmmm... ok🙄