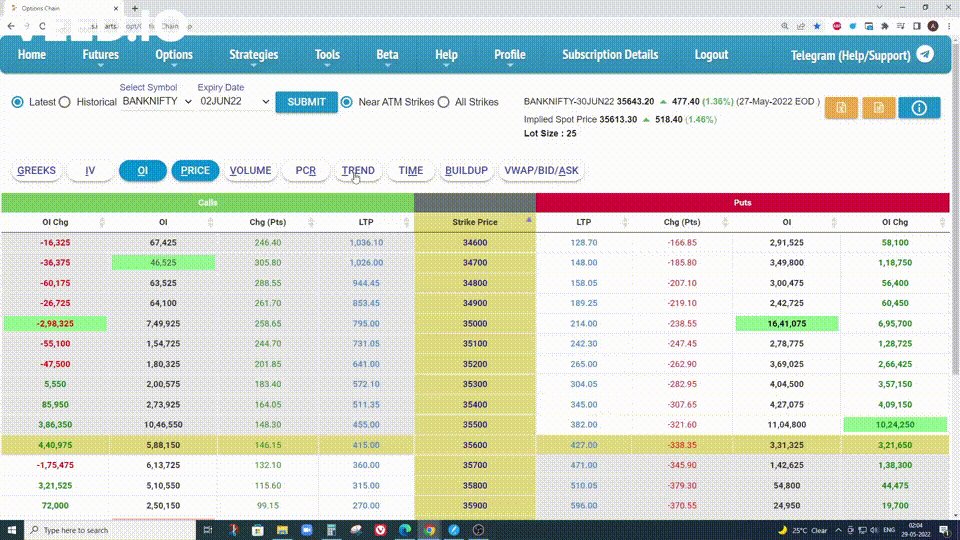
1. Option Chain (Advanced) features
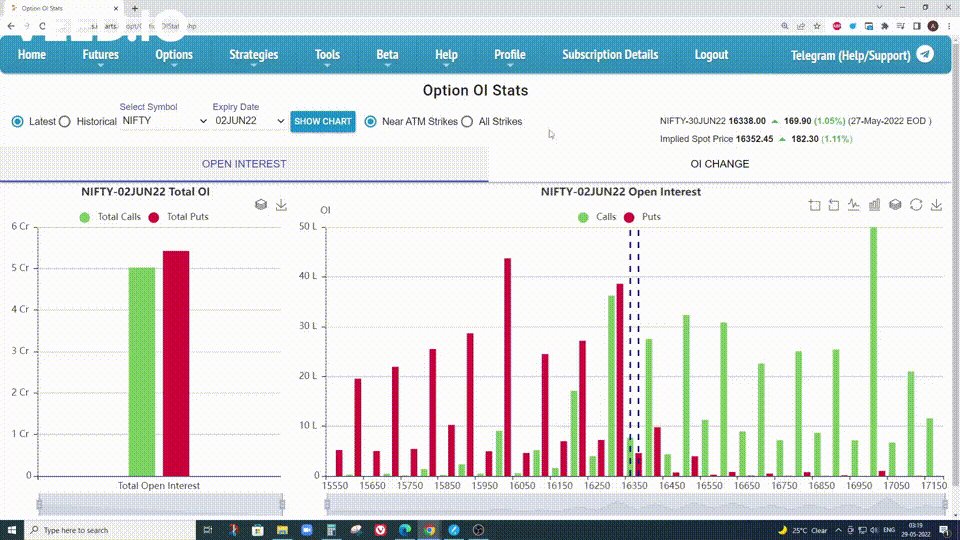
2. Total PE - CE OI
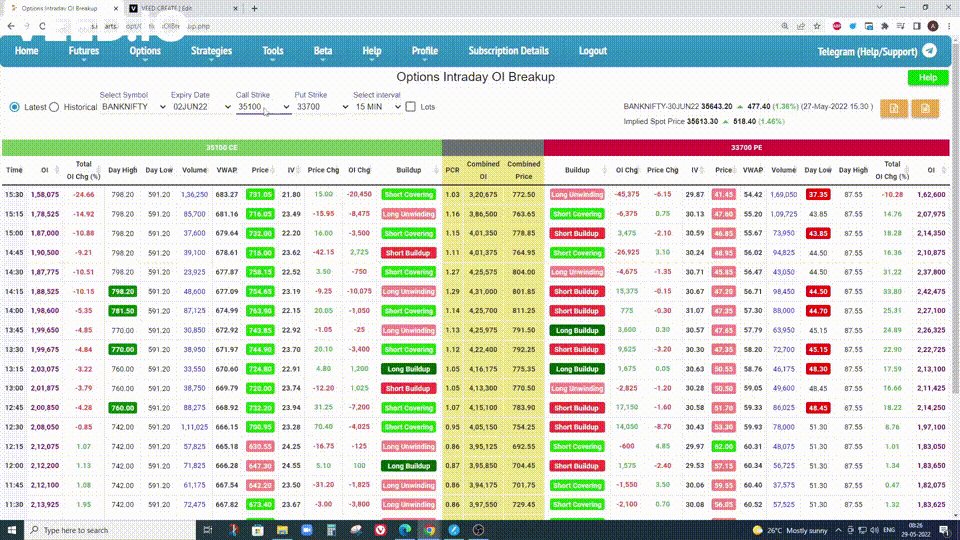
3. Options Intraday OI Breakup
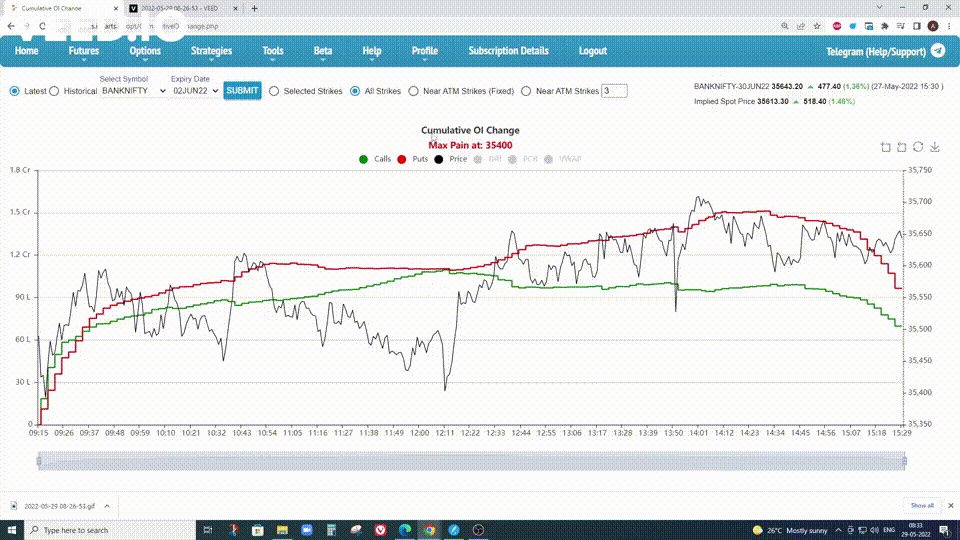
4. Cumulative OI change
5. Backtesting historical Data
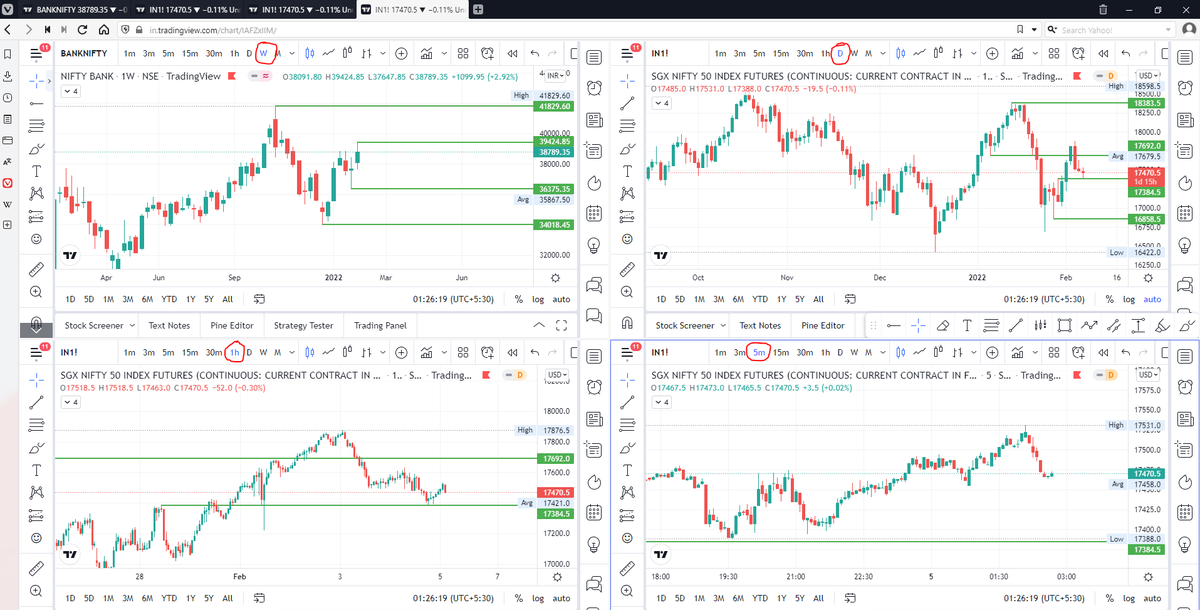
6. Data in different intervals
7. Straddle/Strangle Charts
Let's go ↓


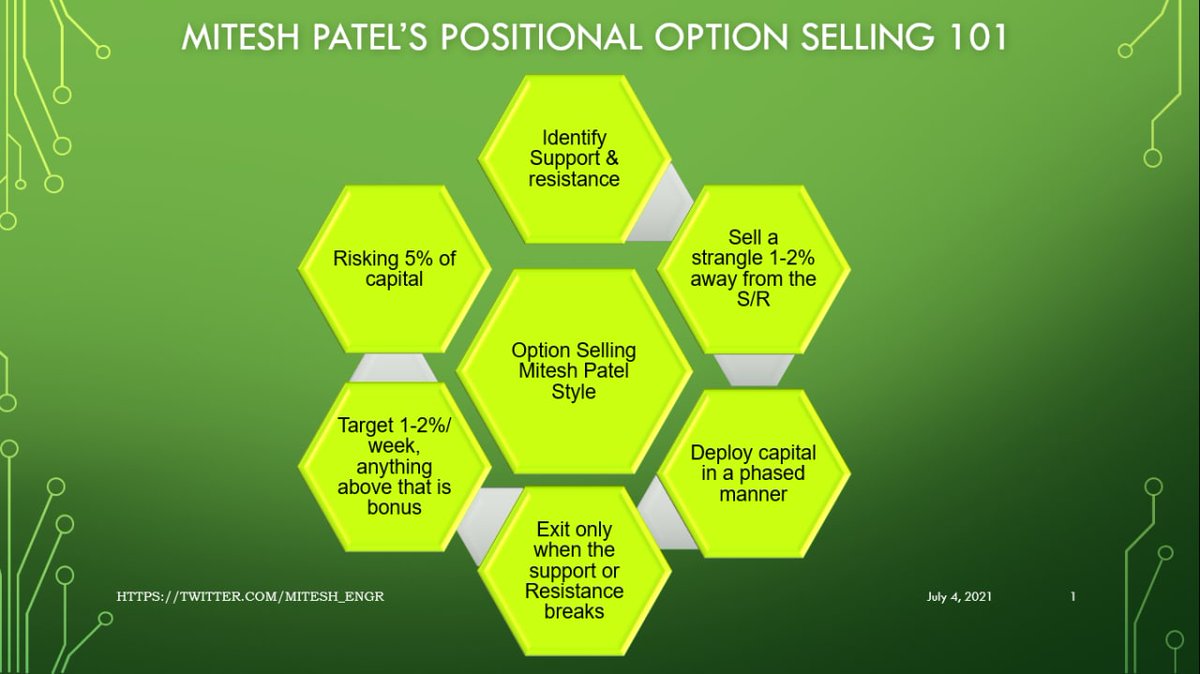
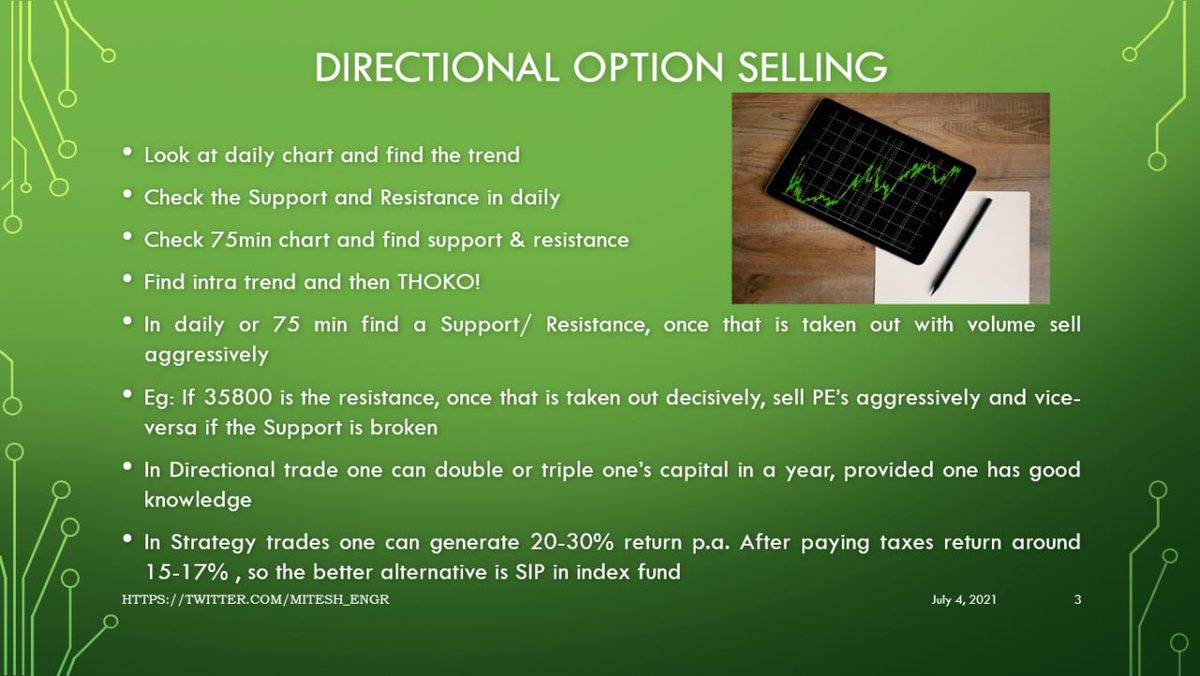
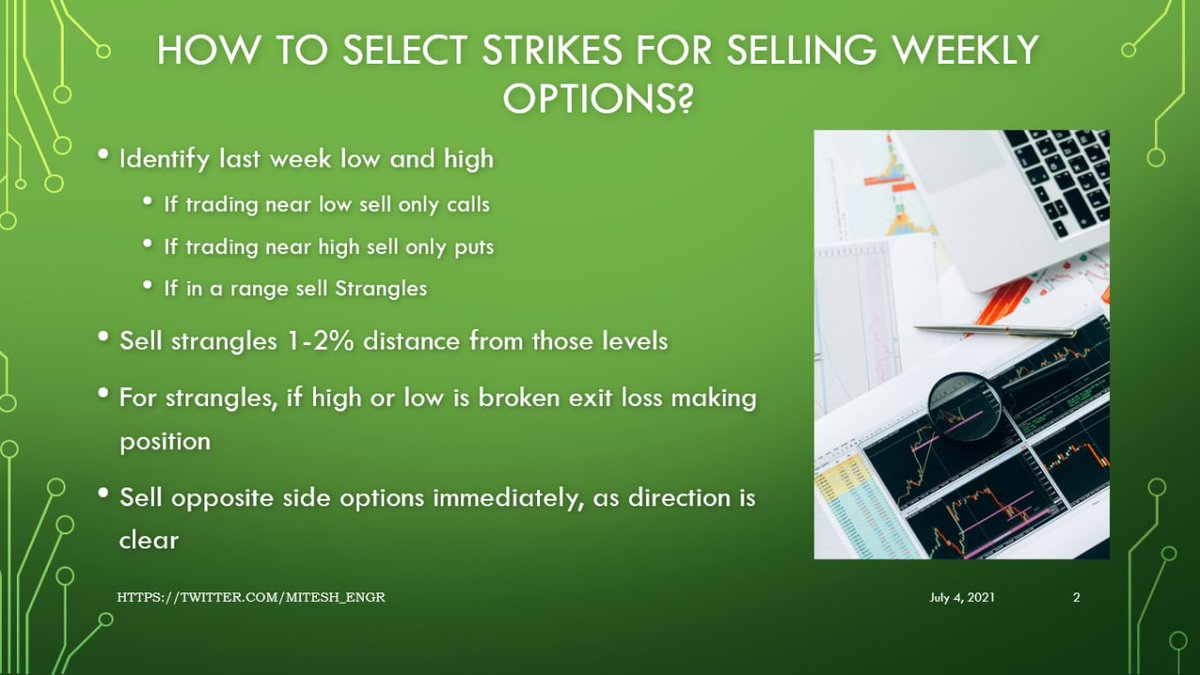
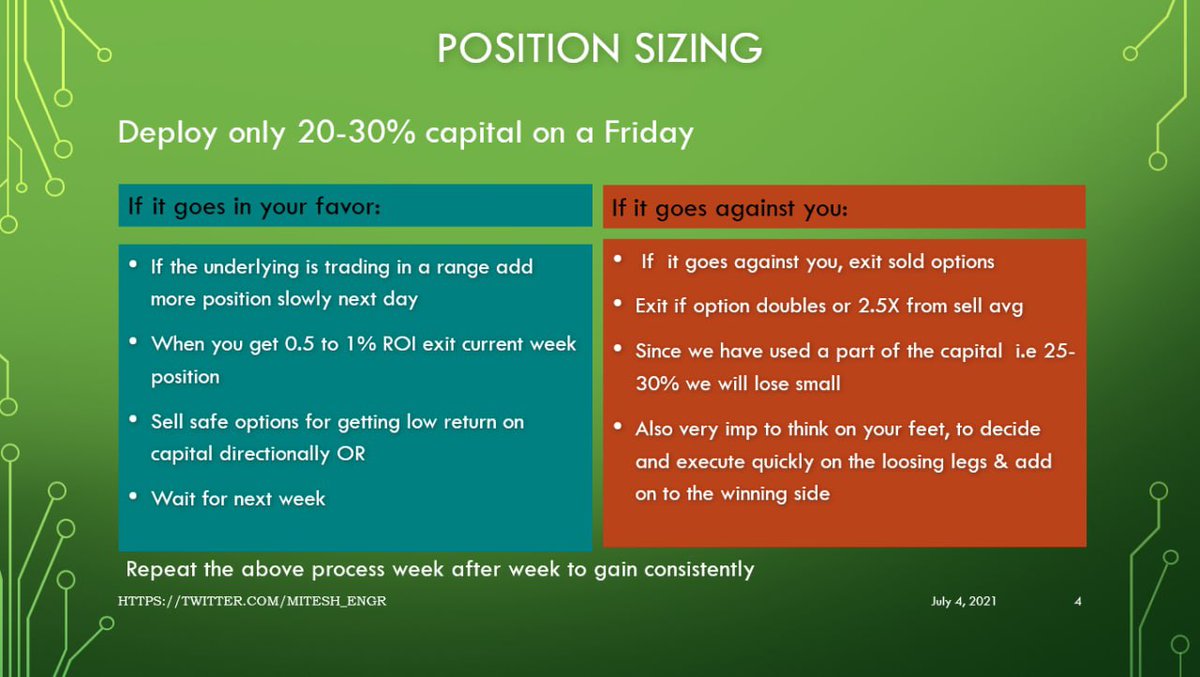
Option Selling is attracting a lot of new traders.
— Aditya Todmal (@AdityaTodmal) October 21, 2022
The best Option Traders love trading in Bank Nifty.
10 Reasons why traders prefer Bank Nifty over Nifty:
Collaborated with @niki_poojary
\U0001f9f5
\U0001d5e0\U0001d602\U0001d5f9\U0001d601\U0001d5f6\U0001d5fd\U0001d5f9\U0001d5f2 \U0001d600\U0001d5f2\U0001d5f0\U0001d601\U0001d5fc\U0001d5ff \U0001d604\U0001d5ee\U0001d601\U0001d5f0\U0001d5f5\U0001d5f9\U0001d5f6\U0001d600\U0001d601 \U0001d5fc\U0001d5fb \U0001d5e7\U0001d5ff\U0001d5ee\U0001d5f1\U0001d5f6\U0001d5fb\U0001d5f4\U0001d603\U0001d5f6\U0001d5f2\U0001d604 \U0001d602\U0001d600\U0001d5f6\U0001d5fb\U0001d5f4 \U0001d601\U0001d5f5\U0001d5f2 \U0001d5d9\U0001d5e5\U0001d5d8\U0001d5d8 \U0001d603\U0001d5f2\U0001d5ff\U0001d600\U0001d5f6\U0001d5fc\U0001d5fb!
— Sarosij Ghosh (@sarosijghosh) September 18, 2021
A THREAD \U0001f9f5
Please Like and Re-Tweet. It took a lot of effort to put this together. #StockMarket #TradingView #trading #watchlist #Nifty500 #stockstowatch
I am quite different from your style. I follow the market's volatility very closely. I have mock positions in 7-8 different strategies which allows me to stay connected. Whichever gives best profit is usually the one i trade in.
— Sarang Sood (@SarangSood) August 13, 2019
Anilji most of the time these days Theta only falls when market moves. So the Theta actually falls where market has moved to, not where our position was in the first place. By shifting we can come close to capturing the Theta fall but not always.
— Sarang Sood (@SarangSood) June 24, 2019
This week has been great so far. The main aim is to be in the right side of the volatility, rest the market will reward.
— Sarang Sood (@SarangSood) July 3, 2019
There is a difference between theta decay & fall in vega. Decay is certain but there is no guaranteed profit as delta moves can increase cost. Fall in vega on the other hand is backed by a powerful force that sells options and gives handsome returns. Our job is to identify them.
— Sarang Sood (@SarangSood) February 12, 2020
— Harsh (@HarshAsserts) September 11, 2020
When trading,moods will want to influence ur decisions
— Banknifty Addict (Gaurav) (@BankniftyA) December 29, 2019
How to minimize:
-Have a backtested plan/system
-Know yourself(emotion and panic levels)
So trade size is important to keep ur emotions in check
-dont focus too much on pnl
-have a back up plan ready
& last stay positive!!
Backtest the complete expiry and practice again and again till u develop conviction
— Banknifty Addict (Gaurav) (@BankniftyA) November 5, 2020
Support and resistance levels based on technical charts on various time frames.
— Banknifty Addict (Gaurav) (@BankniftyA) December 19, 2019
Breaking any of the above, leads to a direction
and then only directional play.