Cur10uslearner's Categories
Cur10uslearner's Authors


Latest Saves
A mega thread to understand the Use of 21 , 50 and 200 ema.
4 Effective uses of Exponential Moving Averages !
Retweet and Share 🔄
#stockmarkets #nifty
@kuttrapali26 @caniravkaria
Once Can refer the use of Moving Averages Throught this thread
ULTIMATE GUIDE TO 21 and 200 Moving Average
— JayneshKasliwal (@JayneshKasliwal) November 14, 2021
SUNDAY THREAD \U0001f516
A trend Following System That will Help You Improve Trading immensely.
RETWEET AND SHARE \U0001f504@kuttrapali26 @AmitabhJha3 #stocks #StockMarket
1/n
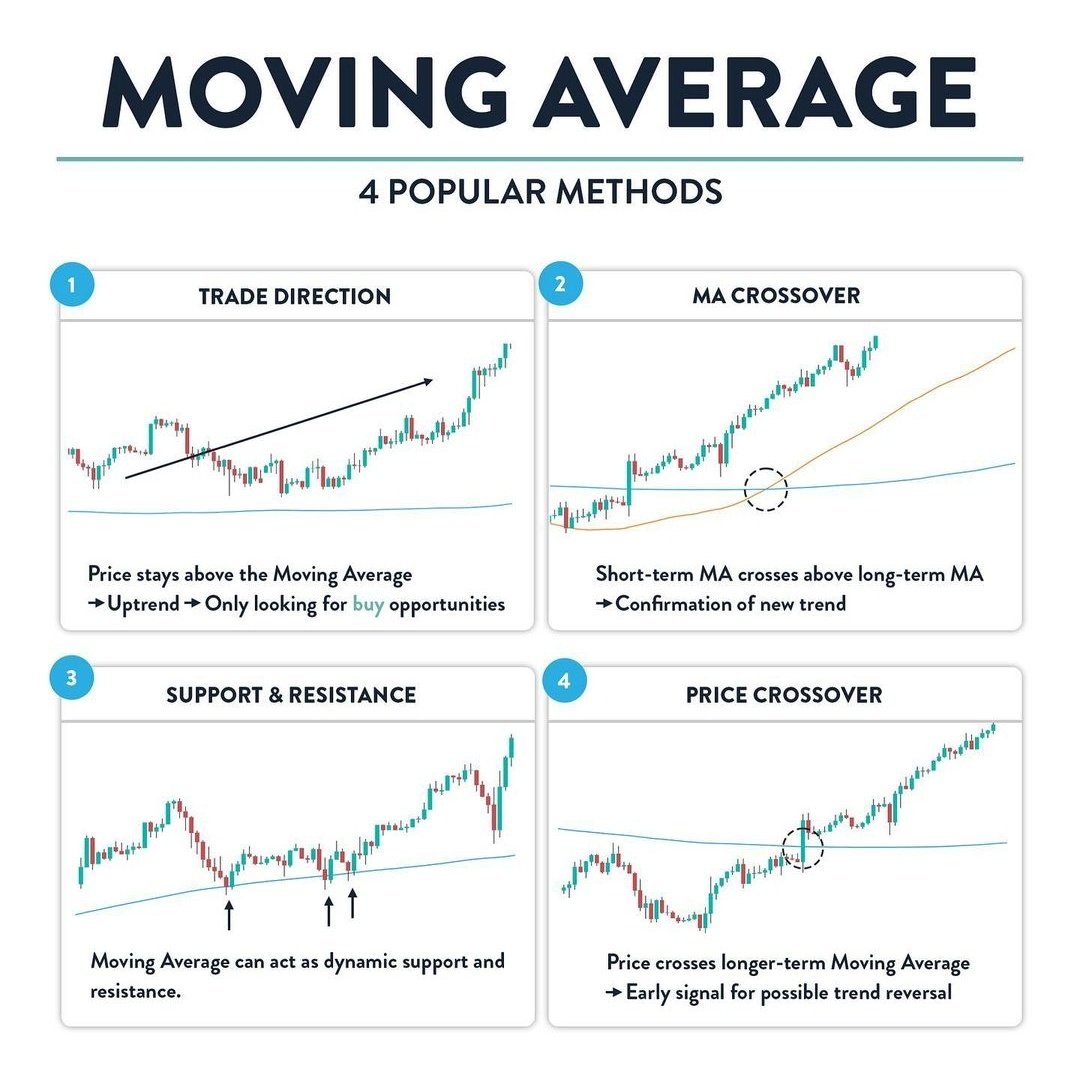
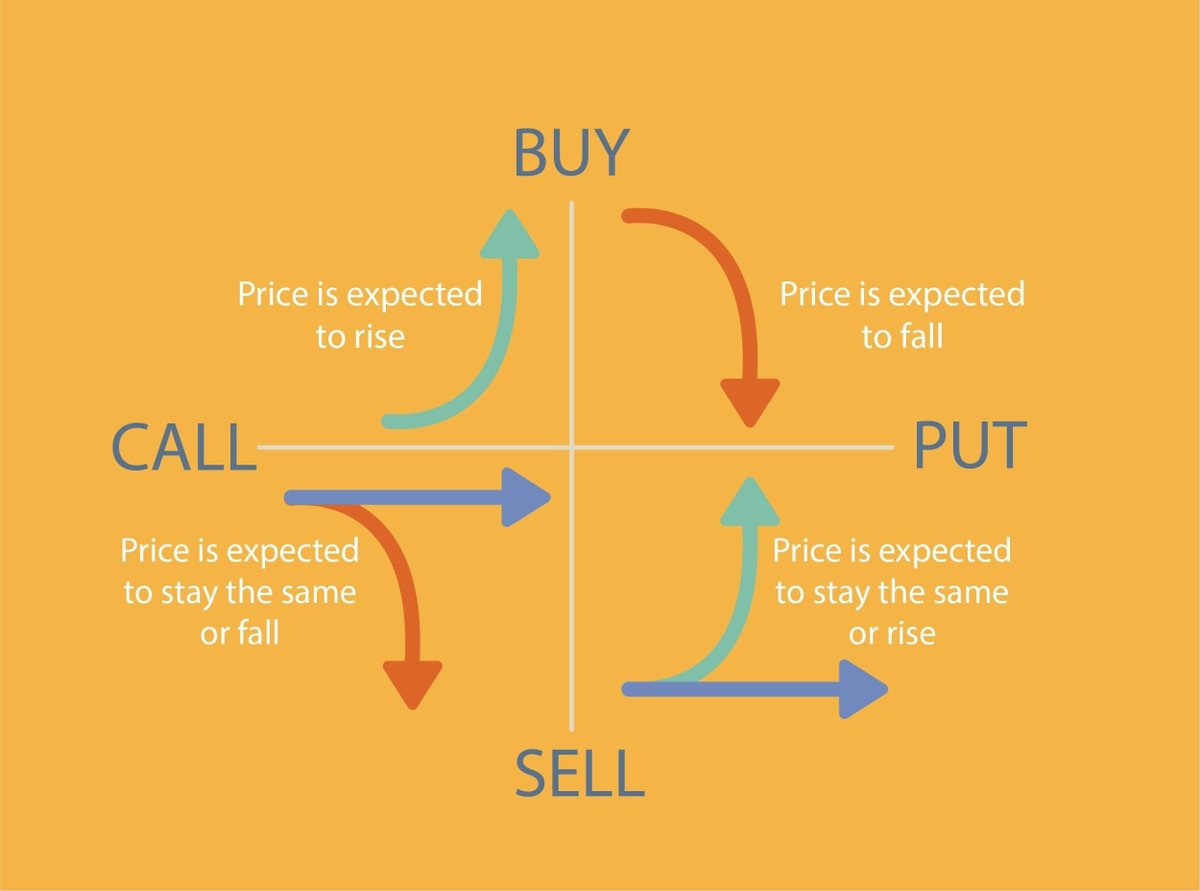
4 Popular uses of moving averages
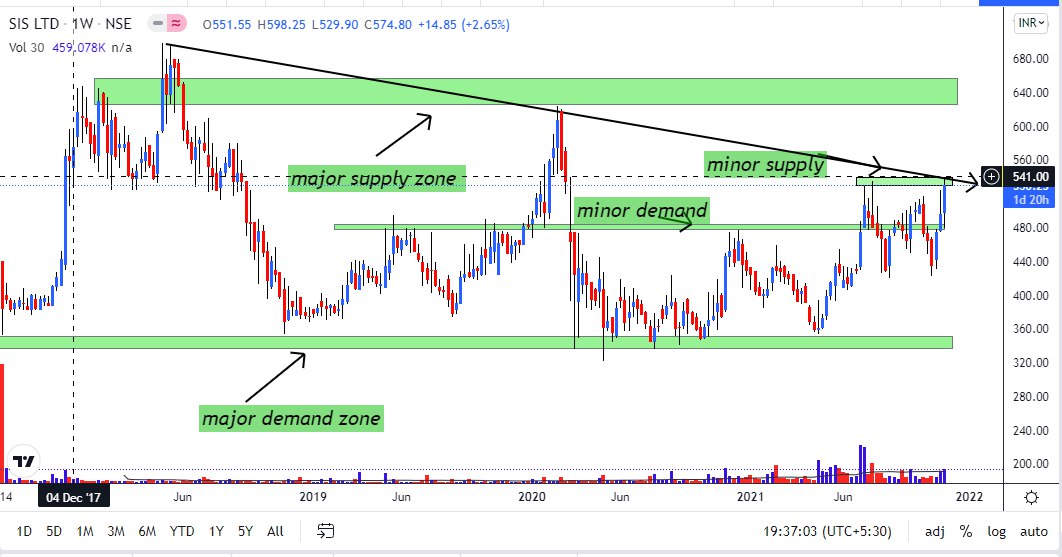
1. Identifying the direction of trend
2. MA crossover
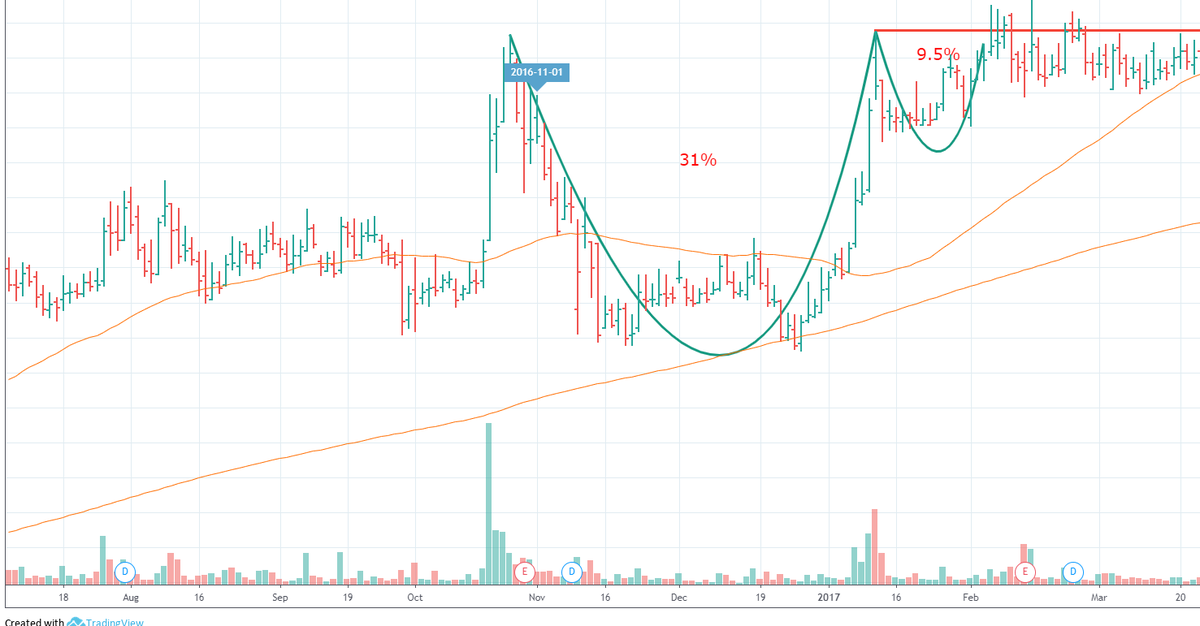
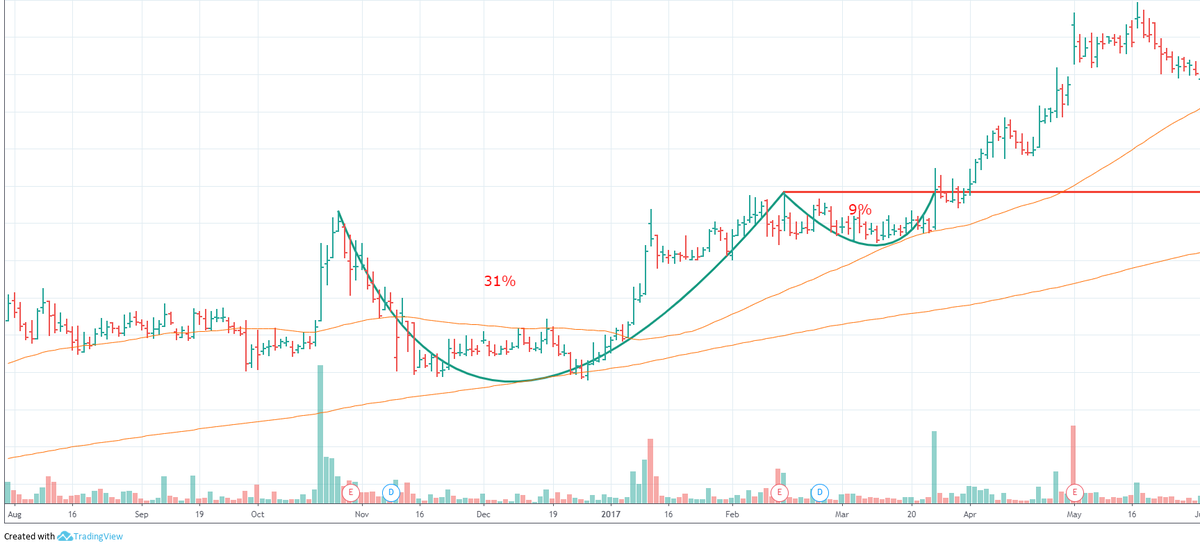
3. Dynamic Support and Resistance
4. Price Crossing above Key EMAs
Note : In chart 21 ema is red , 50 ema is green and 200 ema is black
2/n
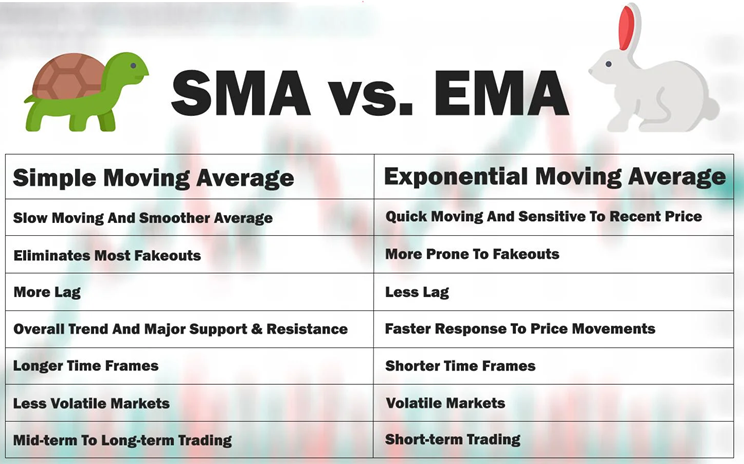
Why EMA and not SMA ?
EMA is fast , accurate and prices in recent data !
3/n
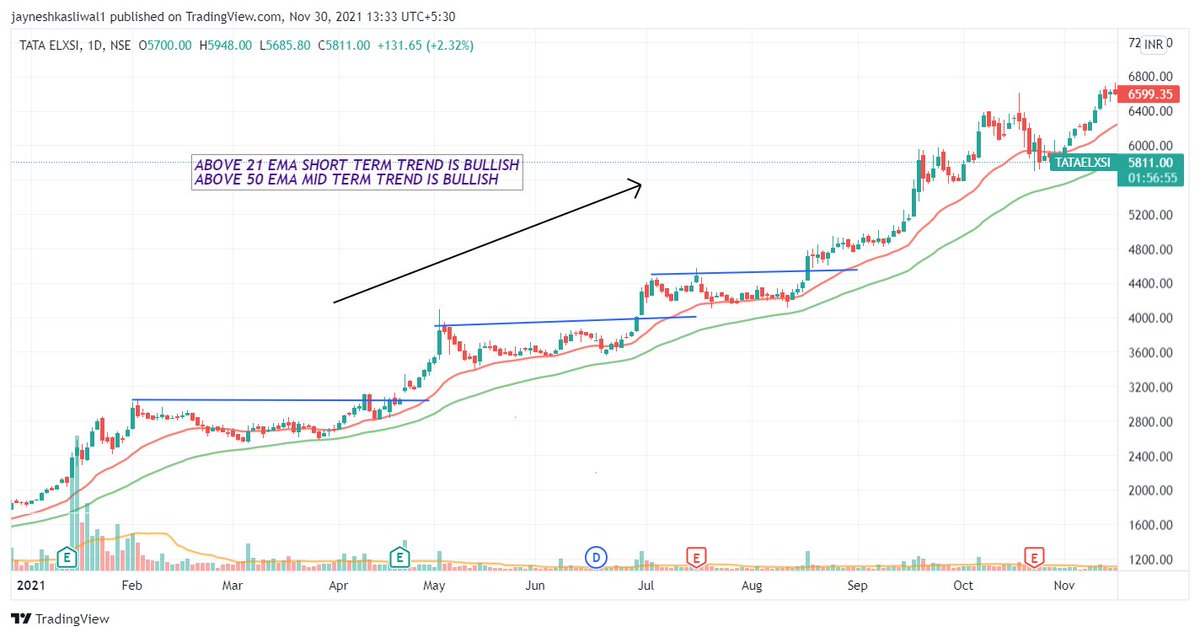
Use 1 : Identifying the trend of stock on dtf
The 21 ema will tell us the Short term trend of a stock , while the 200 ema will tell us the long term trend of a stocks
Any EMA that is sloping
:upwards trend is BULLISH
:sideways trend is NEUTRAL
:downwards trend is BEARISH
4/n


Compiled all of it in one thread👇
📌Beginner Level
JavaScript projects for beginners\U0001f469\u200d\U0001f4bb
— Swastika Yadav \U0001f33b (@swastika0015) June 13, 2021
\U0001f447A thread\U0001f9f5
📌Intermediate Level
Intermediate level Javascript projects
— Swastika Yadav \U0001f33b (@swastika0015) June 16, 2021
\U0001f447A thread\U0001f9f5
📌HTML & CSS
HTML and CSS Projects for beginners\U0001f3a8
— Swastika Yadav \U0001f33b (@swastika0015) July 4, 2021
\U0001f4ccInteractive Resume
\U0001f4ccBuild a Form
\U0001f4ccBasic animations
\U0001f4ccParallax Effect
\U0001f4ccDesign Social app clones
\U0001f4ccDocumentation page
\U0001f4ccClone minimal templates
\U0001f4ccDesign E-commerce site
\U0001f4ccCollege Fest website
\U0001f4ccPortfolio website
\U0001f4ccVideo Background
📌Resources and
12 lesser known websites, resources and tools for Web Developers\u26a1\U0001f6f9
— Swastika Yadav \U0001f33b (@swastika0015) November 23, 2021
A thread\U0001f9f5\U0001f447


This learning thread would be on
"𝙐𝙨𝙚𝙨 𝙤𝙛 𝙍𝙚𝙡𝙖𝙩𝙞𝙫𝙚 𝙎𝙩𝙧𝙚𝙣𝙜𝙩𝙝"
Shared some strategy.
Like👍 & Retweet🔄for wider reach and for more such learning thread in the future.
1/22
Most of us would confuse it with Relative Strength Index (RSI) but Relative Strength is a different indicator.
We have already covered about "Uses of RSI" in below thread👇
https://t.co/oTOrW7joNI
One can go through this if you haven't.
2/22
#RSI is a common indicator which most of us use in the stock market.
— Yash Mehta (@YMehta_) October 22, 2021
This learning thread would be on
"\U0001d650\U0001d668\U0001d65a\U0001d668 \U0001d664\U0001d65b \U0001d64d\U0001d64e\U0001d644"
Like\U0001f44d & Retweet\U0001f504 for wider reach and for more such learning thread in the future.
Also, an investment strategy is shared using RSI in the end.
1/16
Now coming to Relative Strength (RS).
It is basically a strategy used in momentum investing which shows strength or weakness between two asset classes (two stocks, index, commodity).
One can read about this in below
As of now, I am using this indicator on .@tradingview platform.
It's free and one can add it in their Tradingview account as well, using this link👇
https://t.co/FxCjJFsNOG
There are multiple variants in this as well. Some traders use multiple time frame RS.
4/22
RS basically compares returns of one stock/index with the returns of benchmark stock/index at a particular time horizon.
Let's say, I want to analyze TCS and Benchmark Index is Nifty.
5/22


A few weeks ago, I shared a thread—How to Win (without talent or luck)—that got a lot of attention.
One of the most popular insights I shared was the idea of operating in your Zone of Genius.
But I got a lot of questions about how to practically achieve that...
How to Win (without talent or luck):
— Sahil Bloom (@SahilBloom) October 16, 2021
Your Zone of Genius is where your interests, passions and skills align.
Operating in it means you stop playing *their* games and start playing *yours*.
This thread shares my framework—built through personal struggle—for finding and operating in your Zone of Genius:
First, let's get one thing straight.
Everyone has a Zone of Genius.
"Genius" here is a relative term, not an absolute.
It's not about being top 1% at something—it's about the unique space where your relative strengths are accentuated (and relative weaknesses masked).
Furthermore, everyone’s Zone of Genius is different and unique to them as an individual.
The goal of a founder, startup, or organization, therefore, is to build a team with complementary—not conflicting—Zones of Genius.
This is where 1+1=3!


Criteria
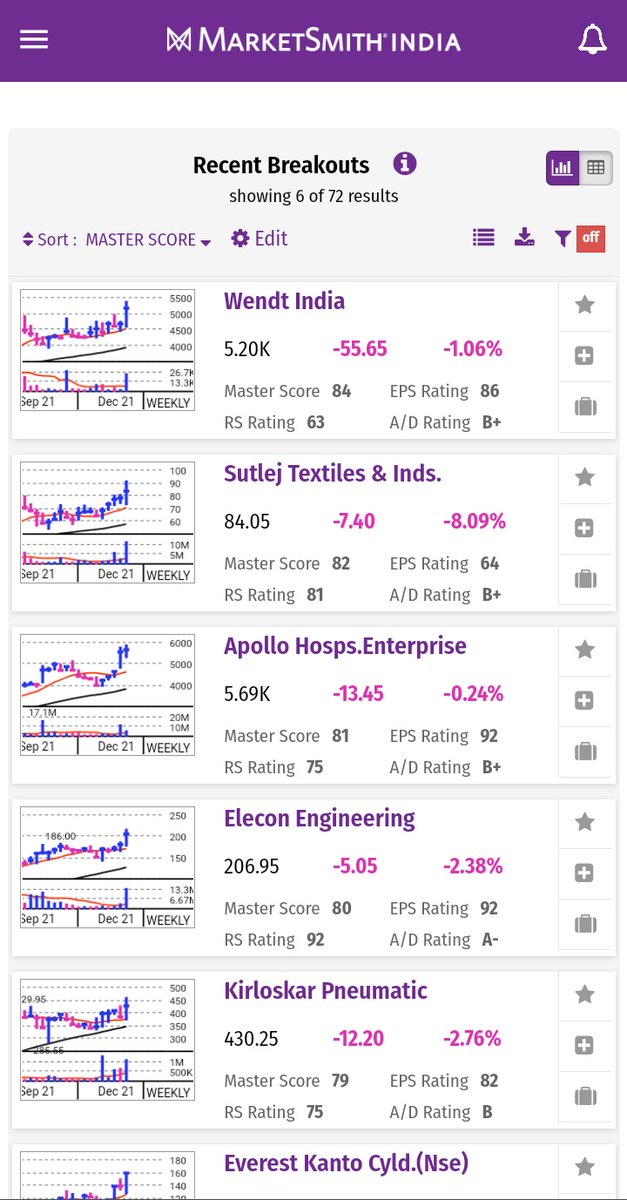
Screener to Find Swing Stocks.
1. 15% Range of Near 52 week high
2. Avg Volume > 1 lakh
3. Market Cap > 2000 Cr
4. Roe Roce > 20%
5. Eps Increasing Qtr on Qtr
6. Above 50 ema
1/
How to use This Screener
1. Basically we are screening Fundamentally strong stock
2. These are Technically Strong also as stocks are near 52 week high and above 50 ema
3. Below is the list For the screened Stocks.
4. Target should be on RR
@StocksNerd @MarketScientist
2/
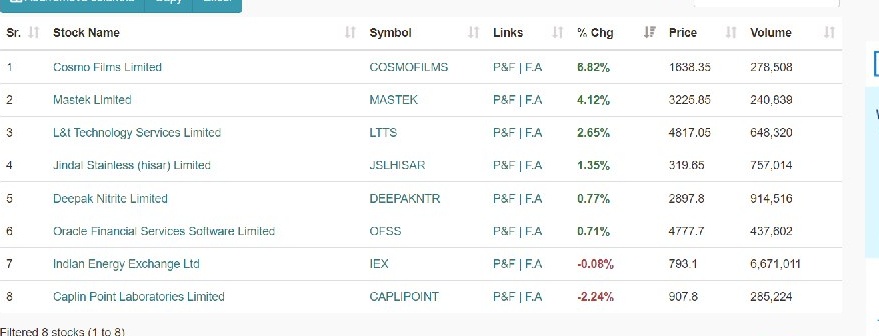
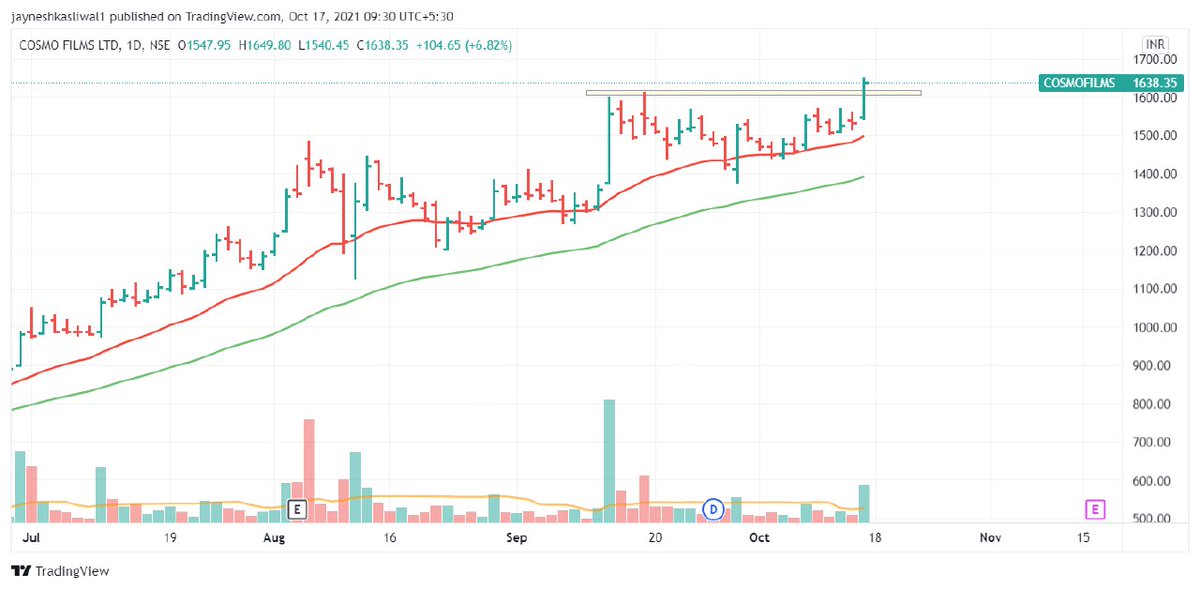
When to Enter
1. When 52 week High is Broken
2. Filter Stocks Select Stock With High Relative Strength
Example : #CosmoFilms , #Mastek
3. Keep Sl Below 21 ema
4. Keep Trailing Using 21 ema
5. Enter stocks on high volume breakout
6.Look for Price Range Contraction
3.
Your Most work is done by the screener
The most important task is filtering out manually and that's where your Returns will differ
As we are screening TechnoFunda stocks these can used for momentum investing
Join telegram https://t.co/b4N4oPAto9
@AmitabhJha3 @chartians


Here I will share what I believe are essentials for anybody who is interested in stock markets and the resources to learn them, its from my experience and by no means exhaustive..
First the very basic : The Dow theory, Everybody must have basic understanding of it and must learn to observe High Highs, Higher Lows, Lower Highs and Lowers lows on charts and their
Even those who are more inclined towards fundamental side can also benefit from Dow theory, as it can hint start & end of Bull/Bear runs thereby indication entry and exits.

Next basic is Wyckoff's Theory. It tells how accumulation and distribution happens with regularity and how the market actually
Dow theory is old but
Old is Gold....
— Professor (@DillikiBiili) January 23, 2020
this Bharti Airtel chart is a true copy of the Wyckoff Pattern propounded in 1931....... pic.twitter.com/tQ1PNebq7d