The Ultimate Guide to moving averages !
A mega thread to understand the Use of 21 , 50 and 200 ema.
4 Effective uses of Exponential Moving Averages !
Retweet and Share 🔄
#stockmarkets #nifty
@kuttrapali26 @caniravkaria
Once Can refer the use of Moving Averages Throught this thread
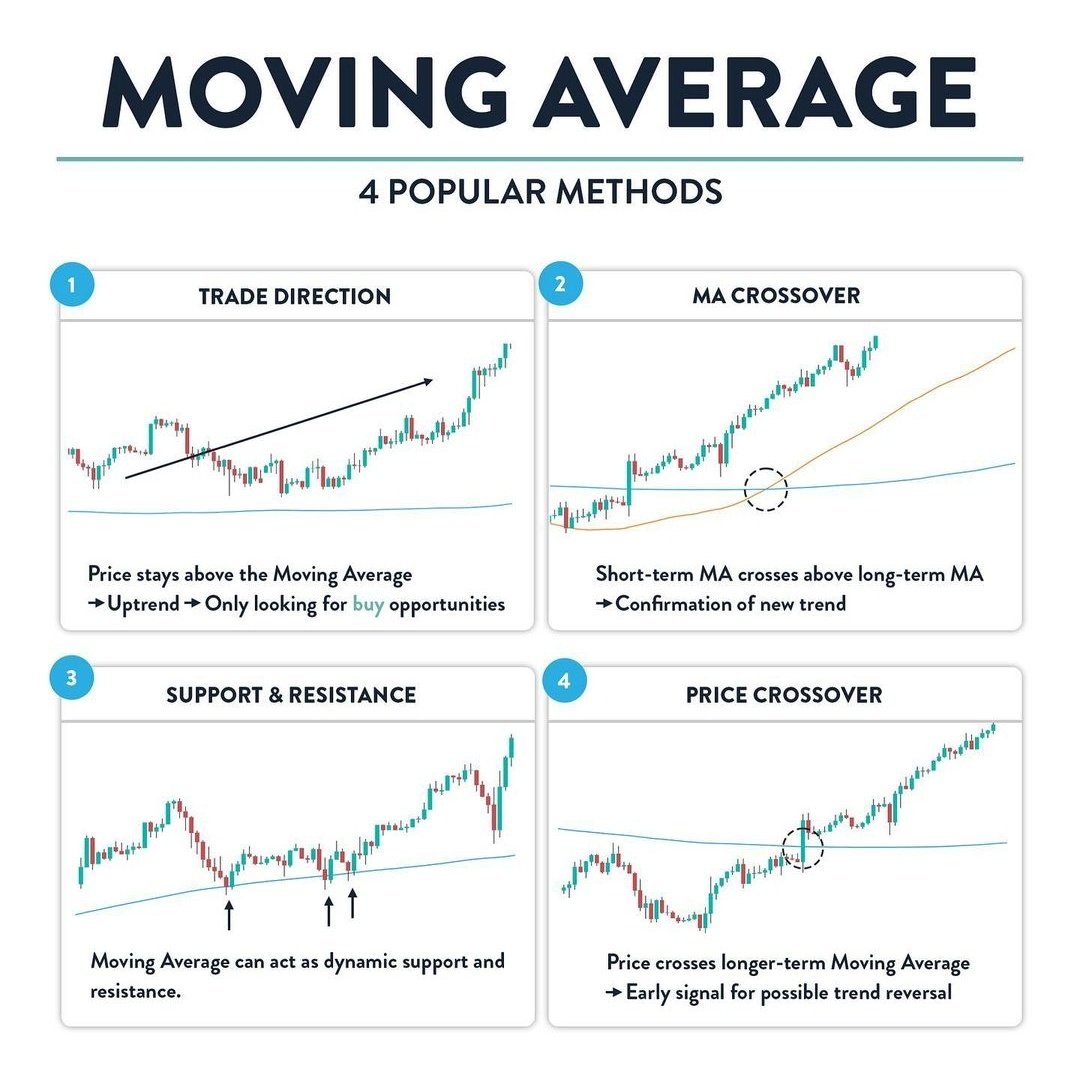
4 Popular uses of moving averages
1. Identifying the direction of trend
2. MA crossover
3. Dynamic Support and Resistance
4. Price Crossing above Key EMAs
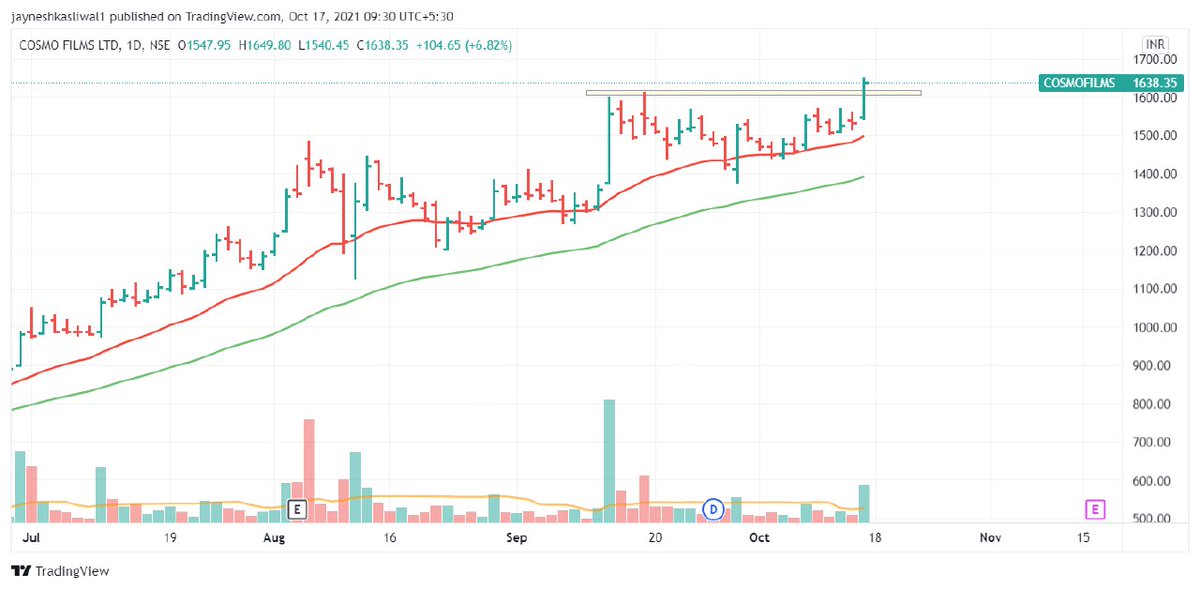
Note : In chart 21 ema is red , 50 ema is green and 200 ema is black
2/n
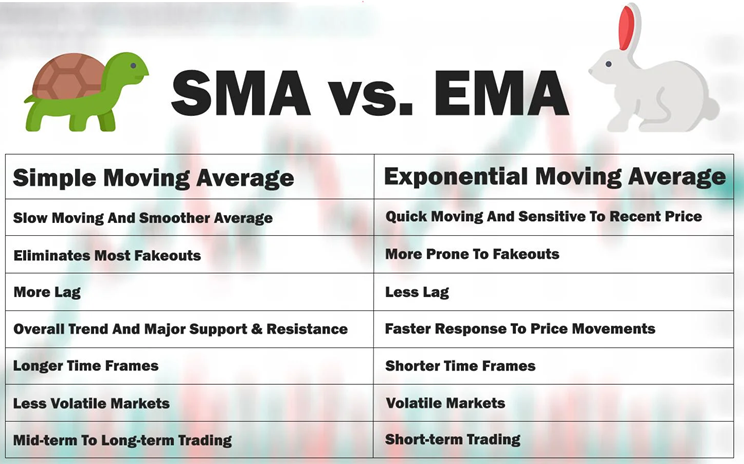
Why EMA and not SMA ?
EMA is fast , accurate and prices in recent data !
3/n
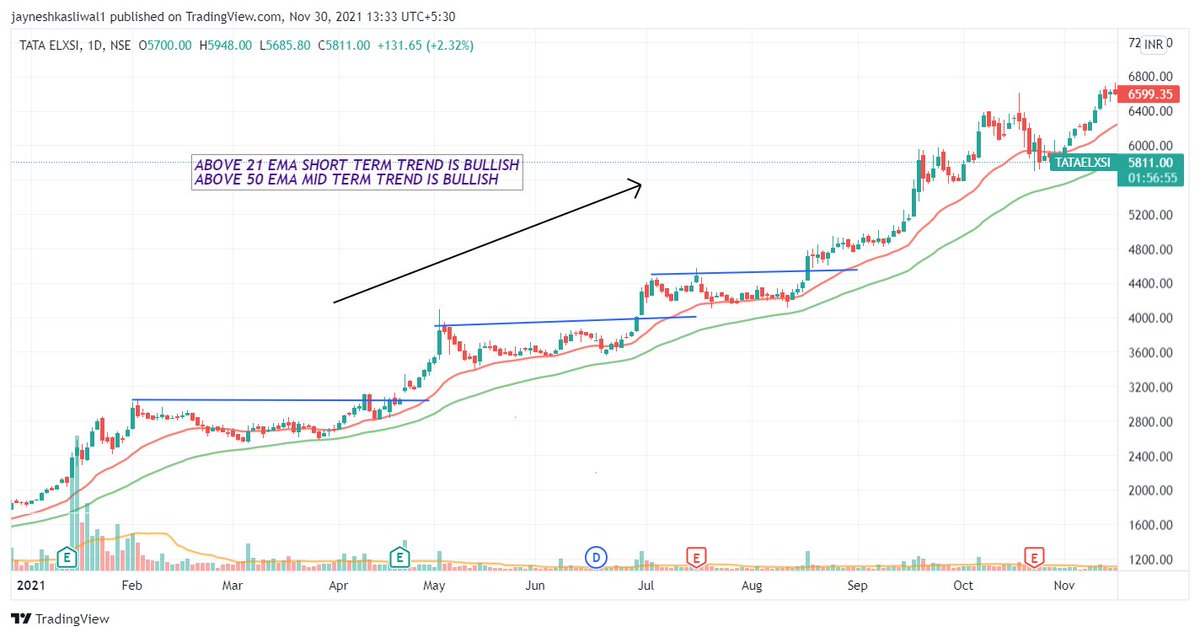
Use 1 : Identifying the trend of stock on dtf
The 21 ema will tell us the Short term trend of a stock , while the 200 ema will tell us the long term trend of a stocks
Any EMA that is sloping
:upwards trend is BULLISH
:sideways trend is NEUTRAL
:downwards trend is BEARISH
4/n