
Here comes the 3rd and final part of the long weekend 'Beginners' Pathway" series.
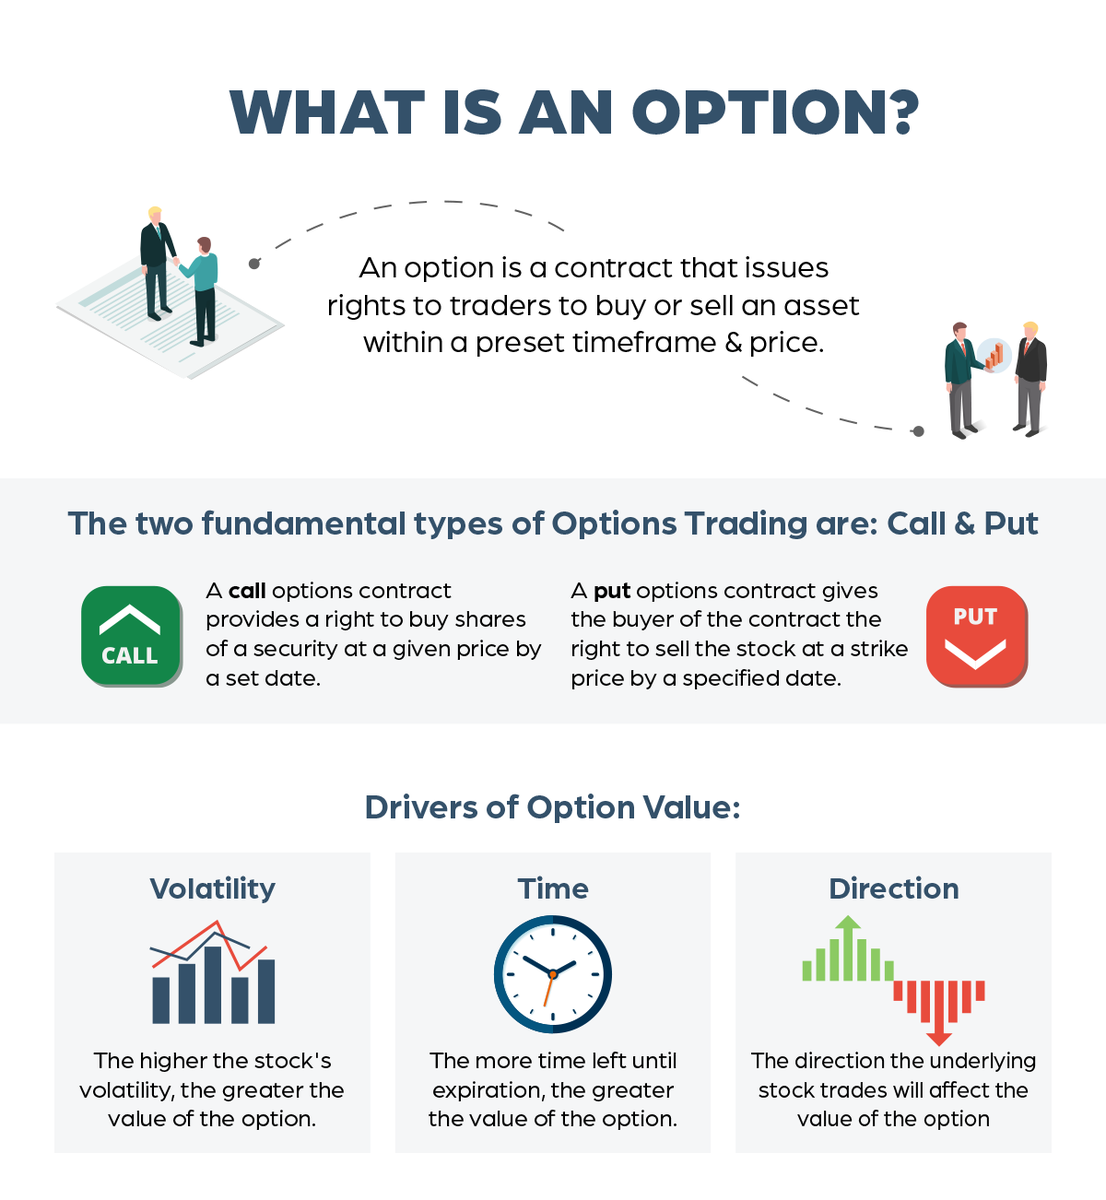
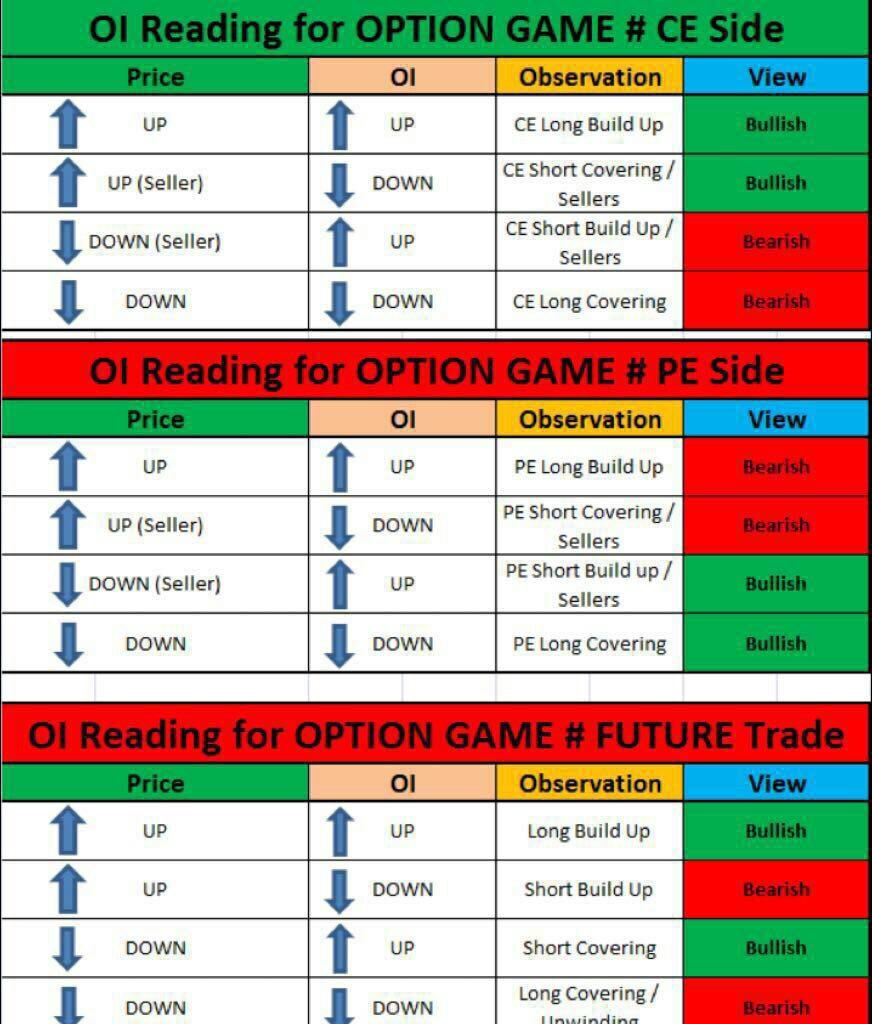
In this we'll see Open Interest basics and Option Chain Analysis.
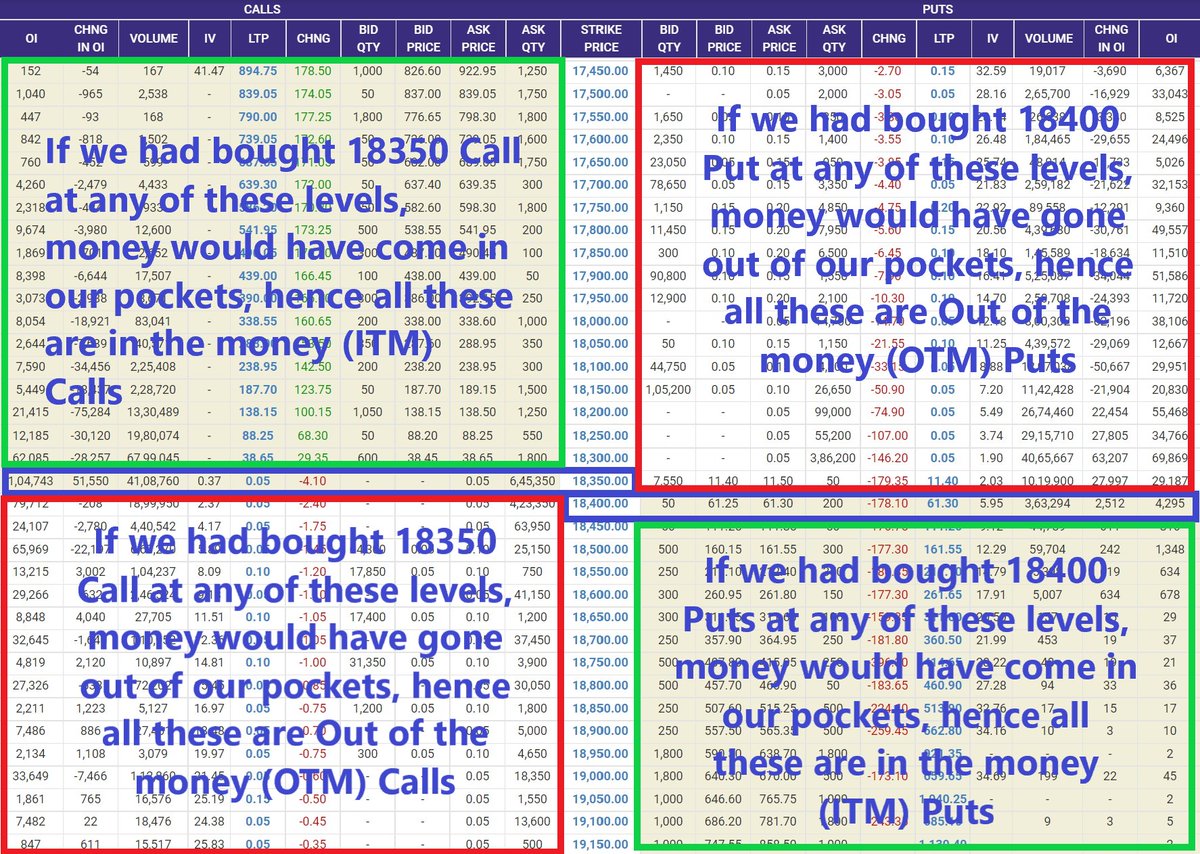
The strike closest to the market price is At The Money.
I have tried to explain OTM & ITM in a very simplistic & easy manner.

More from Professor

More from Optionslearnings

#Learning Those who are interested in options... Here is an old tweet on gamma scalping ...
#Straddle #Gammascalping #Learning Success In option writing can be achieved only by adjustments based on the market developments. The same goes with straddle strategy as well. A method called gamma scalping helps to minimize potential loss in straddles. pic.twitter.com/qgSmgd8RWM
— HMK alias MANOJ (@scorpiomanojFRM) June 19, 2020


volatility is very high when market open big gap down or option up hote he and jab market settle hota he option price cool down hote he agar market up bhi ja raha ho to bhi buy option utna nahi badenga ..
He maine kyun likha tha ?? Or call buy kyun nahi kaha tha ?? Kyun sirf put sell kaha Agar maarket up hi jane wala tha to koi bata sakta he ?? https://t.co/w21XemUTLo
— itrade(DJ) (@ITRADE191) May 12, 2021


You May Also Like


A list of cool websites you might now know about
A thread 🧵
1) Learn Anything - Search tools for knowledge discovery that helps you understand any topic through the most efficient
2) Grad Speeches - Discover the best commencement speeches.
This website is made by me
3) What does the Internet Think - Find out what the internet thinks about anything
4) https://t.co/vuhT6jVItx - Send notes that will self-destruct after being read.

