ULTIMATE GUIDE TO 21 and 200 Moving Average
SUNDAY THREAD 🔖
A trend Following System That will Help You Improve Trading immensely.

RETWEET AND SHARE 🔄
@kuttrapali26 @AmitabhJha3
#stocks #StockMarket
1/n

Moving averages
EMA and SMA
1. Exponential Moving Average (EMA) is similar to Simple Moving Average (SMA), measuring trend direction over a period of time.
2. However, whereas SMA simply calculates an average of price data, EMA applies more weight to data that is more current
2/
21 EMA : SHORT TERM TREND
1. Calculates the Average Price of past 21 days
2. A stock above 21 ema is in strong momentum , which will give pullbacks to 21 ema again and again.
3. Stock above 21 ema should never be shorted so as to stay with the trend
3/n
3. A stock which moves 10-15% above 21 ema will be too extended and hence will generally pullback
Stocks take dynamic support on 21 ema
4. You can Short only if its too extended like 15 to 20% from 21 ema ( Not advised )
#ADANIPOWER:
#pnbhousing
4/n
1. Whenever 21 ema is sloping upwards its called uptrend
2. Whenever 21 ema is sloping downwards its called dowtrend
3. Whenever 21 ema is sideways its called consolidation
⏫Buy in uptrend
⏬Sell in downtrend
Examples:
5/n
Use this simple trend following system to buy and sell stocks
Helps you to identify reversal in trend
Works well in trending market and trending stocks
Ideal place to sell a stock is its moved more than 15% away from 21 ema
Risk increases the farther you buy from 21 ema
6/n
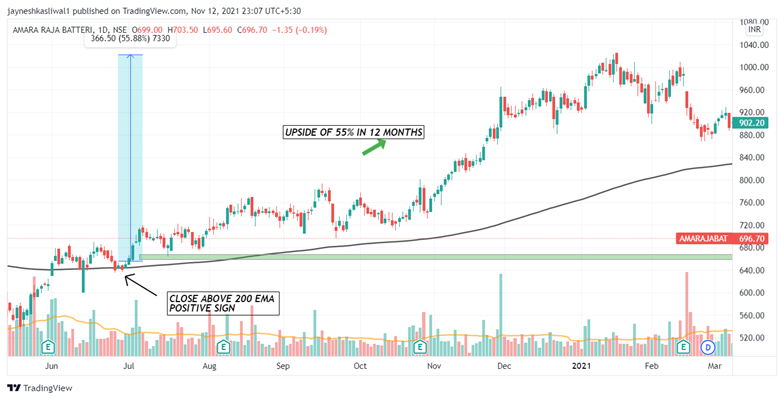
200 EMA : THE LONG TERM TREND
1. When a stock price crosses its 200-day moving average, it is a technical signal that a reversal has occurred.
2. A stock above 200 ema is considered bullish in its long term trend and if its below 200 ema its considered bearish
7/n
3. A simple rule of not buying stocks below 200 ema for short term trading could save a lot of money
4. One may consider investing in stocks if the stock is below 200 ema only if he is confirmed about the fundamentals of the stock
5. Some may not agree with this and its ok!
8/n
200 EMA : DYNAMIC SUPPORT FOR STOCKS
#BHEL AND #NAVINFLOURINE
9/n
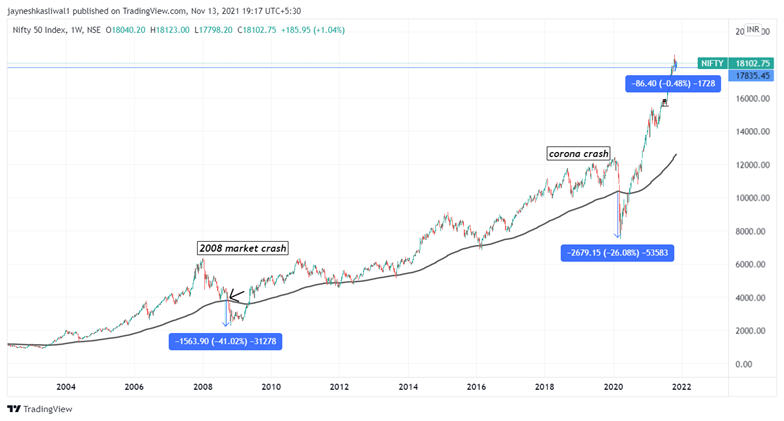
The 200 ema helps to identify where the market breath is
During the corona crash if the simple system was used you would have saved 35% drawdown in your account
Using 200 ema beats the buy and hold strategy which over the years haven been proved in book
200 ema THE SAVIOUR :
10/
WEEKLY 200 EMA : VERY LONG TERM VIEW:
1. If you use 200 ema on weekly timeframe you can be in a trend for a very long time
2.The sell signs will be given late as we are using weekly timeframe
11/n
3. You will have bigger drawdown compared to daily time frame
4. Weekly timeframe will give less signals while daily timeframe will give lot of whipsaws during sideways trend .
12/n
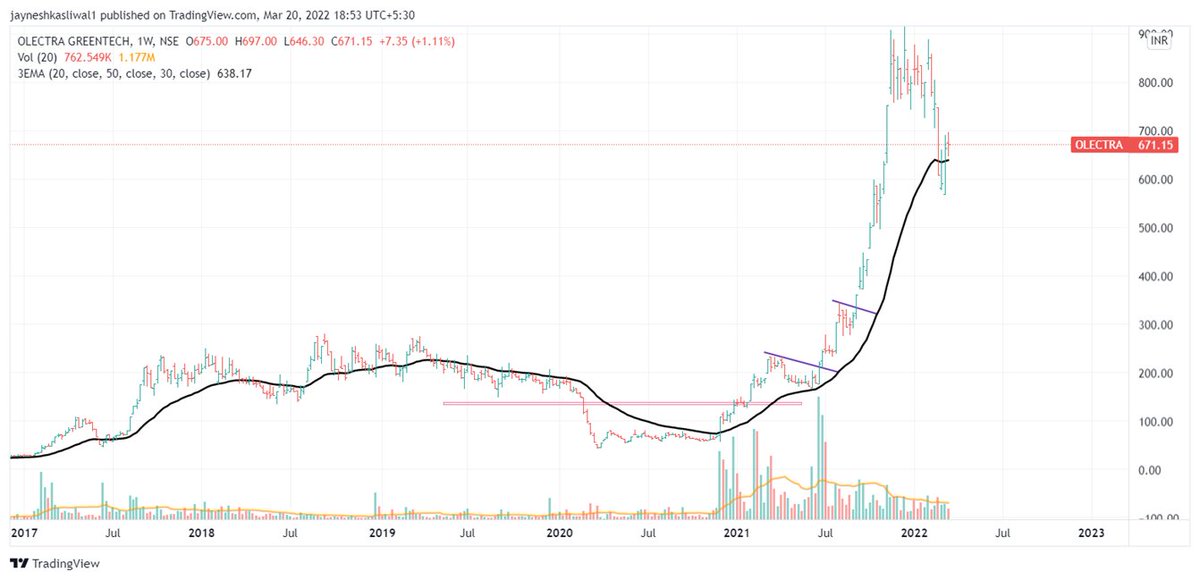
LONG TERM INVESTING WITH 200 EMA
MULTIBAGGER:
#infy #britannia
Most multibagger stocks will stay above weekly 200 ema and take support on that
These are strong fundamental stocks which will outperform the market
Laggards will stay below 200 ema and hence should be avoided.
13/n
HOW TO SAVE YOURSELF FROM MULTIBEGGARS:
#yesbank and #idea .
A simple Criteria Not to buy stocks below 200 ema for long term investing will help you rise multibaggers
If you let your emotions out and be systematic traders this could change your trading
14/n
END
Hope you liked it and if you want to have the pdf please use the link below
https://t.co/T09LUm1HsI
@caniravkaria @MarketScientist

More from JayneshKasliwal

𝟱 𝗧𝗿𝗮𝗱𝗶𝗻𝗴𝘃𝗶𝗲𝘄 𝗜𝗻𝗱𝗶𝗰𝗮𝘁𝗼𝗿𝘀 𝗮𝗹𝗹 𝗧𝗿𝗮𝗱𝗲𝗿𝘀 𝘀𝗵𝗼𝘂𝗹𝗱 𝗸𝗻𝗼𝘄 𝗮𝗯𝗼𝘂𝘁:
𝗣𝗮𝗿𝘁 𝟮

🧵 Thread 🧵
Retweet And I will Link a 36 Page PDF

𝟭. 𝗔𝗱𝗱 𝗙𝘂𝗻𝗱𝗮𝗺𝗲𝗻𝘁𝗮𝗹𝘀 𝗼𝗻 𝗰𝗵𝗮𝗿𝘁
🔸 Link:
https://t.co/HcIXT7V002
🔸 Click on the above link -> Add to Favourites -> Add on Chart from favourites and start using it !
2/20

You can add financials from many fundamental criteria's like
🔸 Cashflows
🔸 Income Statements
🔸 Balance sheets
🔸 PE,PB ratios
🔸 Marketcapitlization
🔸 Statistics
3/20


How to change Settings:
🔸 There are 8 columns you can basically select any financial you want
🔸 You can select quarterly or Yearly values and can also write
🔸 The names of the financiaLS Example : EPS Qtr3
🔸 You can Change colours , font size 
4/20


𝟮. 𝗜𝗻𝗱𝗶𝗰𝗮𝘁𝗼𝗿 𝗥𝗮𝘁𝗶𝗻𝗴𝘀
You cannot track each and every indicator like ( 𝗠𝗼𝘃𝗶𝗻𝗴 𝗔𝘃𝗴𝘀 , 𝗥𝗦𝗜 , 𝗠𝗔𝗖𝗗 ) etc , you can use plot this custom strategy to understand whether the trend is positive or negative of those indicators
5/20

You May Also Like

1/“What would need to be true for you to….X”

Why is this the most powerful question you can ask when attempting to reach an agreement with another human being or organization?

A thread, co-written by @deanmbrody:


2/ First, “X” could be lots of things. Examples: What would need to be true for you to

- “Feel it's in our best interest for me to be CMO"
- “Feel that we’re in a good place as a company”
- “Feel that we’re on the same page”
- “Feel that we both got what we wanted from this deal

3/ Normally, we aren’t that direct. Example from startup/VC land:

Founders leave VC meetings thinking that every VC will invest, but they rarely do.

Worse over, the founders don’t know what they need to do in order to be fundable.

4/ So why should you ask the magic Q?

To get clarity.

You want to know where you stand, and what it takes to get what you want in a way that also gets them what they want.

It also holds them (mentally) accountable once the thing they need becomes true.

5/ Staying in the context of soliciting investors, the question is “what would need to be true for you to want to invest (or partner with us on this journey, etc)?”

Multiple responses to this question are likely to deliver a positive result.
प्राचीन काल में गाधि नामक एक राजा थे।उनकी सत्यवती नाम की एक पुत्री थी।राजा गाधि ने अपनी पुत्री का विवाह महर्षि भृगु के पुत्र से करवा दिया।महर्षि भृगु इस विवाह से बहुत प्रसन्न हुए और उन्होने अपनी पुत्रवधु को आशीर्वाद देकर उसे कोई भी वर मांगने को कहा।


सत्यवती ने महर्षि भृगु से अपने तथा अपनी माता के लिए पुत्र का वरदान मांगा।ये जानकर महर्षि भृगु ने यज्ञ किया और तत्पश्चात सत्यवती और उसकी माता को अलग-अलग प्रकार के दो चरू (यज्ञ के लिए पकाया हुआ अन्न) दिए और कहा कि ऋतु स्नान के बाद तुम्हारी माता पुत्र की इच्छा लेकर पीपल का आलिंगन...

...करें और तुम भी पुत्र की इच्छा लेकर गूलर वृक्ष का आलिंगन करना। आलिंगन करने के बाद चरू का सेवन करना, इससे तुम दोनो को पुत्र प्राप्ति होगी।परंतु मां बेटी के चरू आपस में बदल जाते हैं और ये महर्षि भृगु अपनी दिव्य दृष्टि से देख लेते हैं।

भृगु ऋषि सत्यवती से कहते हैं,"पुत्री तुम्हारा और तुम्हारी माता ने एक दुसरे के चरू खा लिए हैं।इस कारण तुम्हारा पुत्र ब्राह्मण होते हुए भी क्षत्रिय सा आचरण करेगा और तुम्हारी माता का पुत्र क्षत्रिय होकर भी ब्राह्मण सा आचरण करेगा।"
इस पर सत्यवती ने भृगु ऋषि से बड़ी विनती की।


सत्यवती ने कहा,"मुझे आशीर्वाद दें कि मेरा पुत्र ब्राह्मण सा ही आचरण करे।"तब महर्षि ने उसे ये आशीर्वाद दे दिया कि उसका पुत्र ब्राह्मण सा ही आचरण करेगा किन्तु उसका पौत्र क्षत्रियों सा व्यवहार करेगा। सत्यवती का एक पुत्र हुआ जिसका नाम जम्दाग्नि था जो सप्त ऋषियों में से एक हैं।
Trading view scanner process -

1 - open trading view in your browser and select stock scanner in left corner down side .

2 - touch the percentage% gain change ( and u can see higest gainer of today)


3. Then, start with 6% gainer to 20% gainer and look charts of everyone in daily Timeframe . (For fno selection u can choose 1% to 4% )

4. Then manually select the stocks which are going to give all time high BO or 52 high BO or already given.

5. U can also select those stocks which are going to give range breakout or already given range BO

6 . If in 15 min chart📊 any stock sustaing near BO zone or after BO then select it on your watchlist

7 . Now next day if any stock show momentum u can take trade in it with RM

This looks very easy & simple but,

U will amazed to see it's result if you follow proper risk management.

I did 4x my capital by trading in only momentum stocks.

I will keep sharing such learning thread 🧵 for you 🙏💞🙏

Keep learning / keep sharing 🙏
@AdityaTodmal