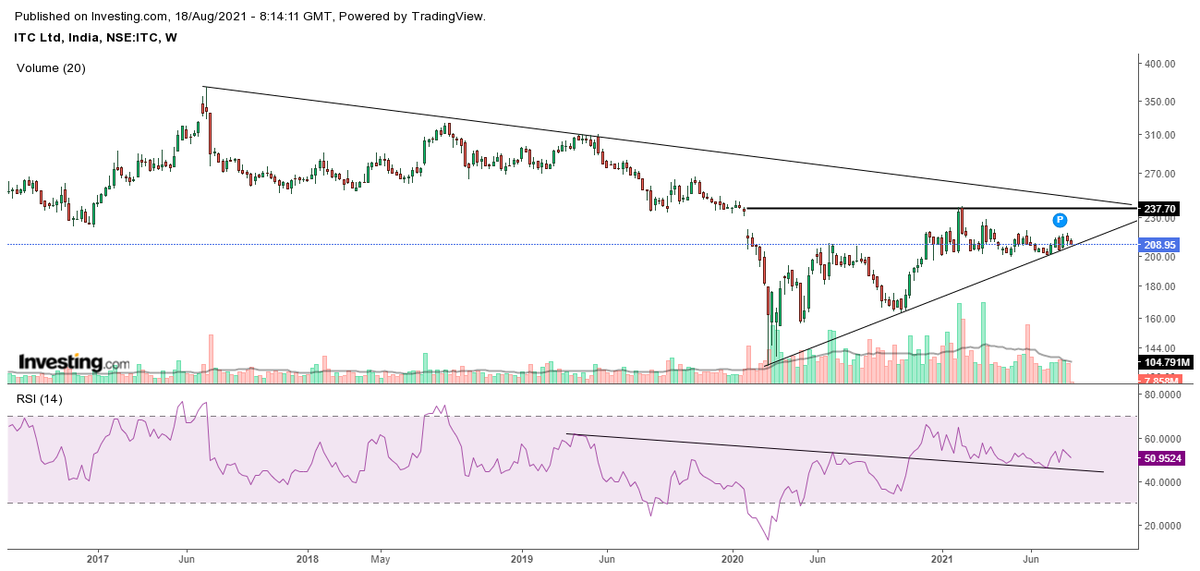
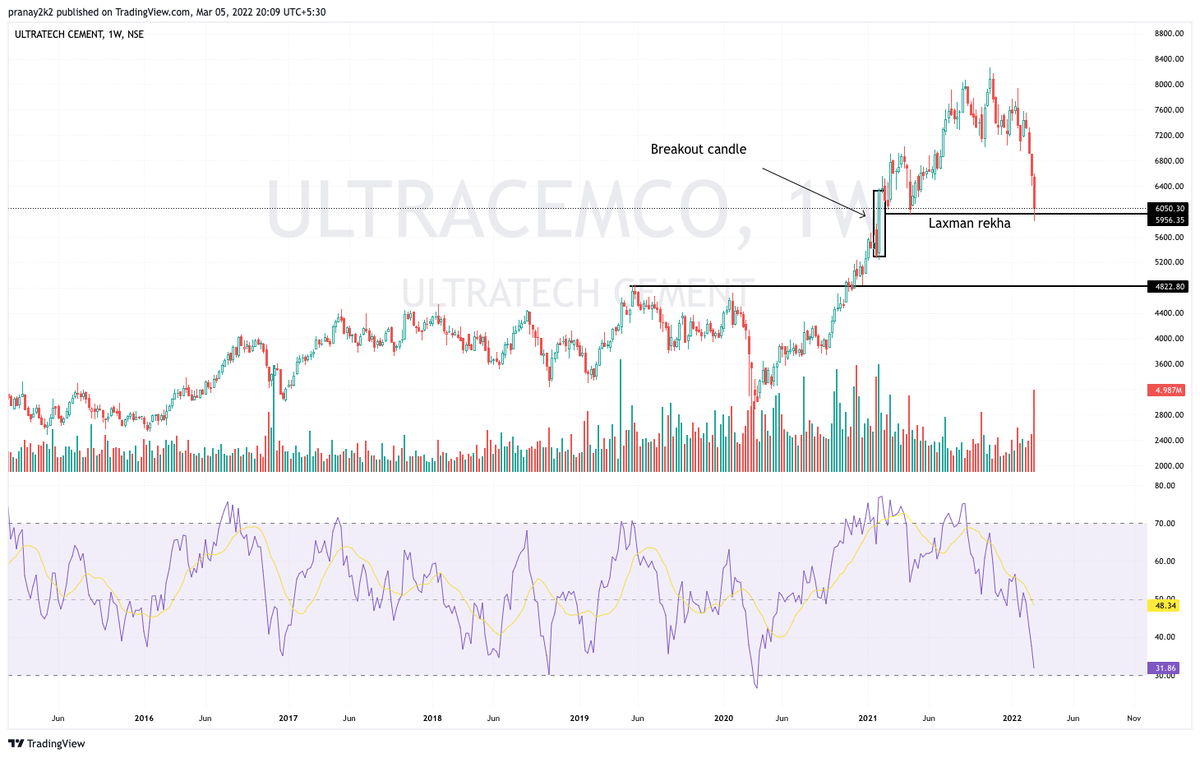
If you guys followed onething in case of #tv18broadcast #TV18BRDCST which we discussed so many times I guess..
Then you must have saved your money & avoided such setup in advance 😊
** Never expect multiyear breakout when monthly RSI above 70 **
More from Pranay Prasun
#jubilantfoodworks #Dominos #Dunkin #popeyes
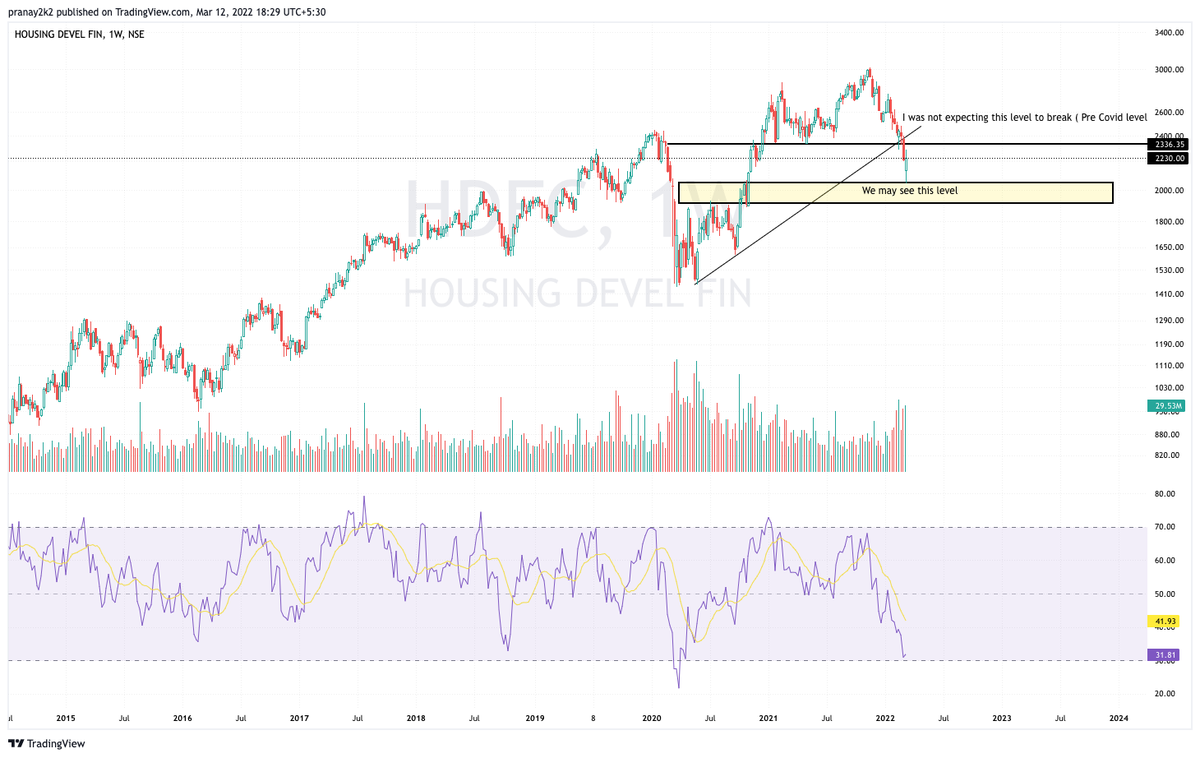
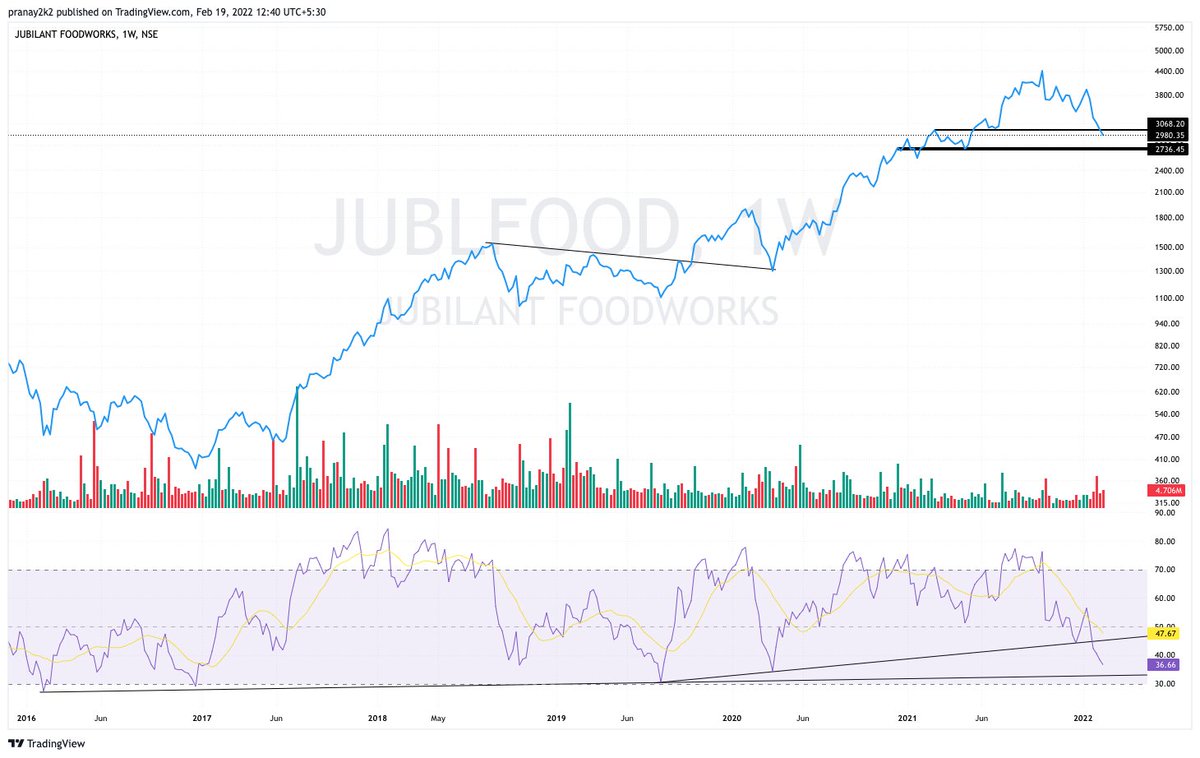
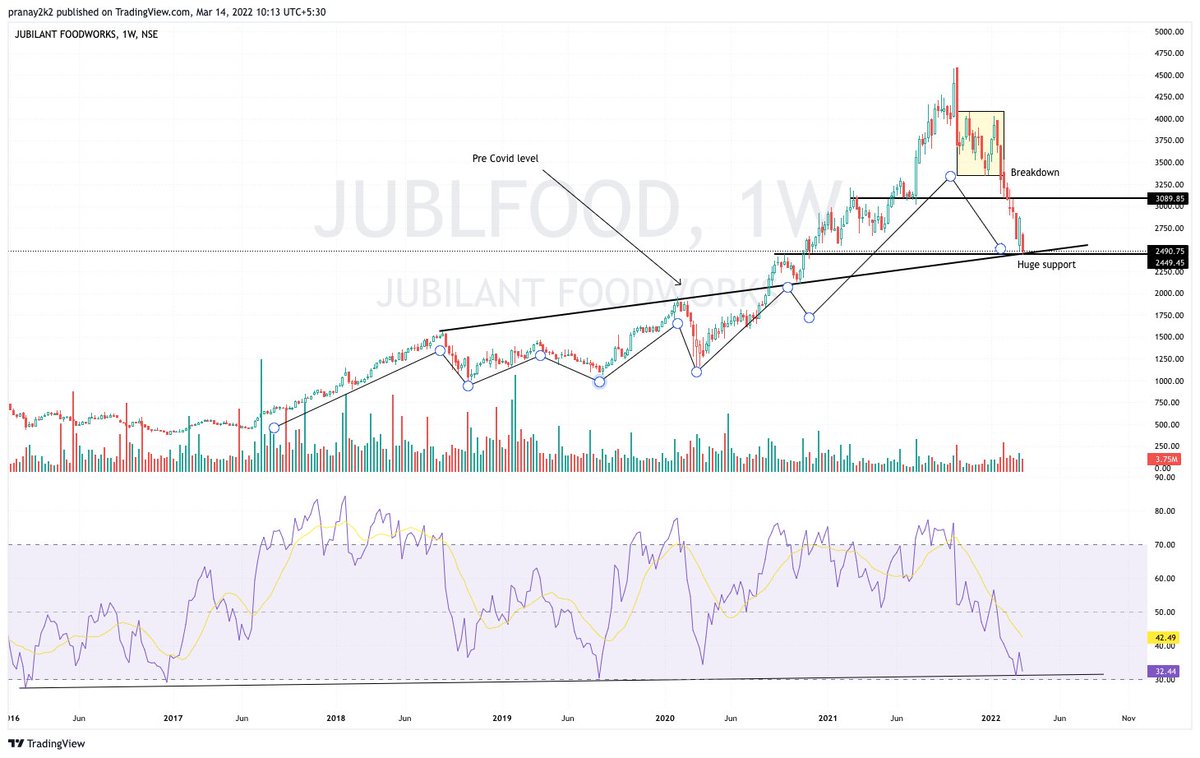
I was expecting reversal from 3000-3100 level but didn't work and looks like we may see 2600-2700 level
~ Already booked small loss and waiting for right entry
~ Shared weekly chart for reference https://t.co/OFsuLsYN2z
I was expecting reversal from 3000-3100 level but didn't work and looks like we may see 2600-2700 level
~ Already booked small loss and waiting for right entry
~ Shared weekly chart for reference https://t.co/OFsuLsYN2z
#Jubilantfoodworks Upside or Breakdown ? Good RR at CMP https://t.co/HXaHFX5fLt pic.twitter.com/RX5nREYuGU
— Pranay Prasun (@PranayPrasun) February 13, 2022
More from Screeners


VWAP for intraday Trading Part -2
A small thread.
PART 1 - https://t.co/ooxepHpYKL
Traders show your support by like & retweet to benefit all
@Mitesh_Engr @ITRADE191 @ProdigalTrader @nakulvibhor @RajarshitaS @Puretechnicals9 @AnandableAnand @Anshi_________ @ca_mehtaravi

Chart 1
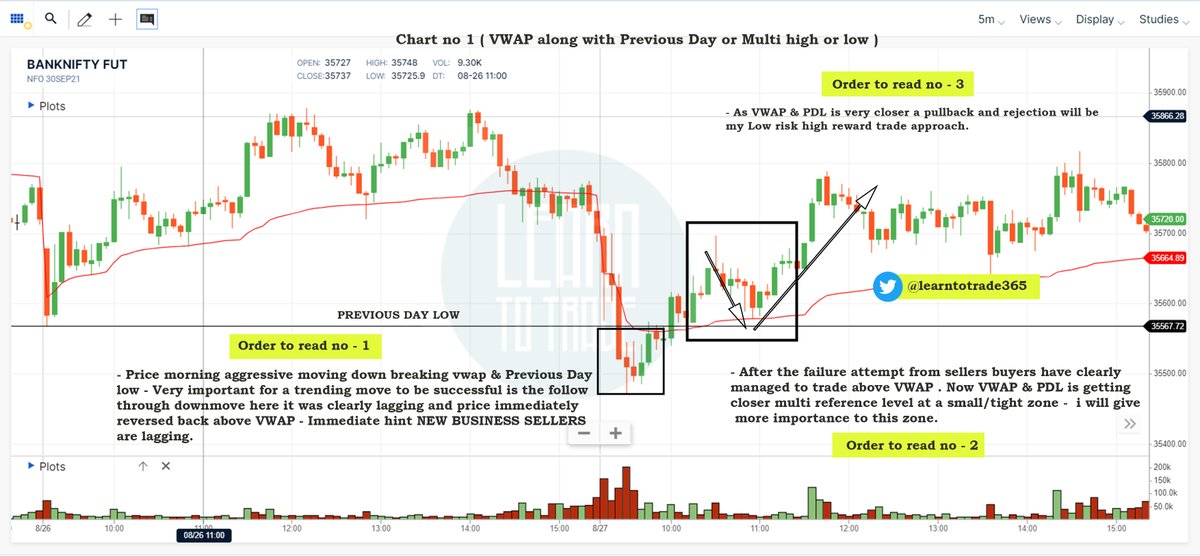
Chart 2
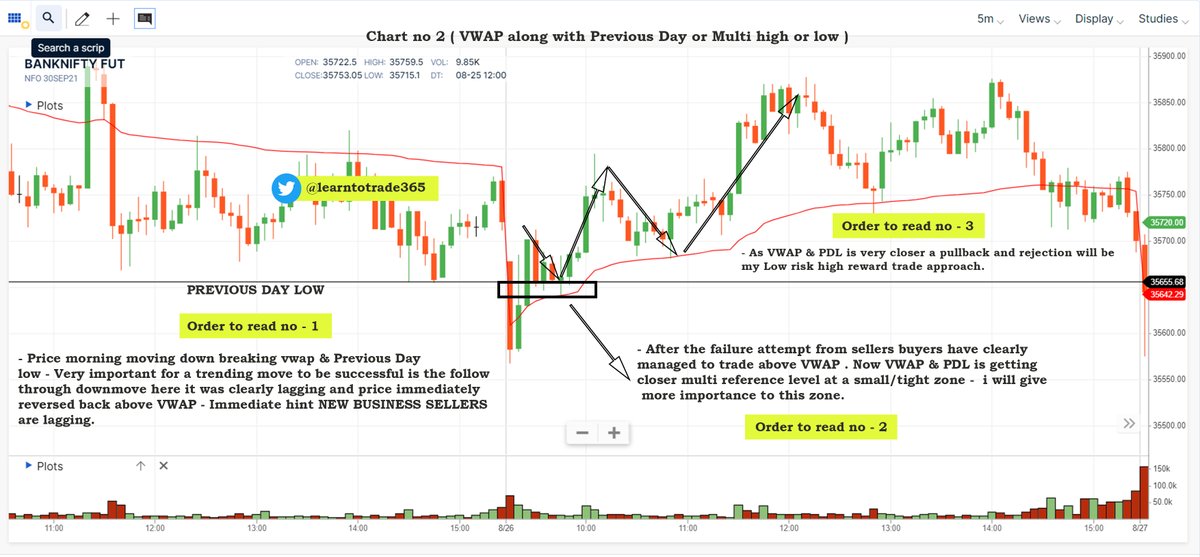
Chart 3
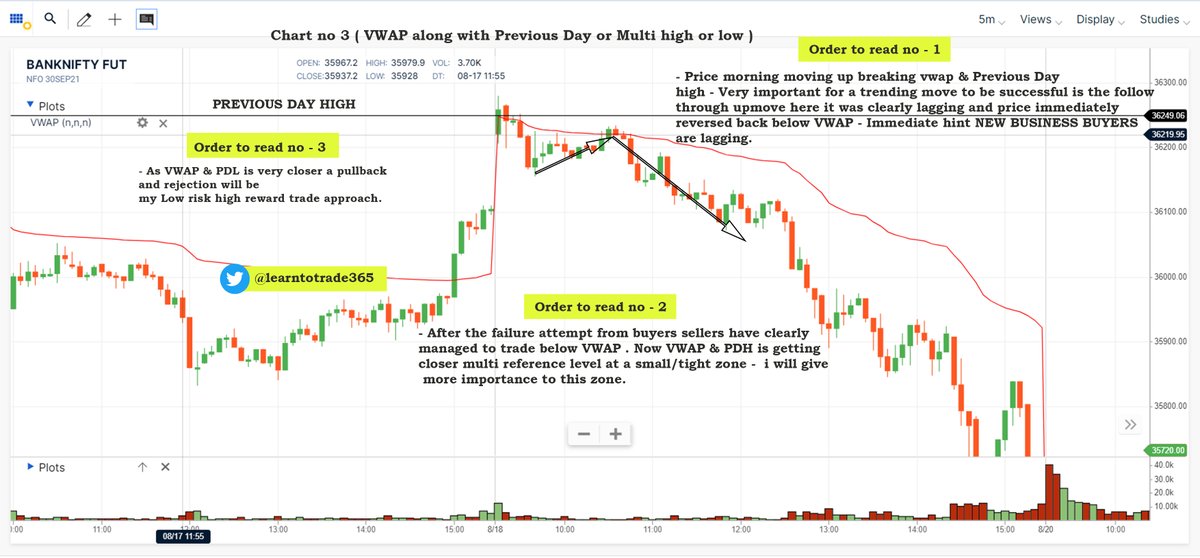
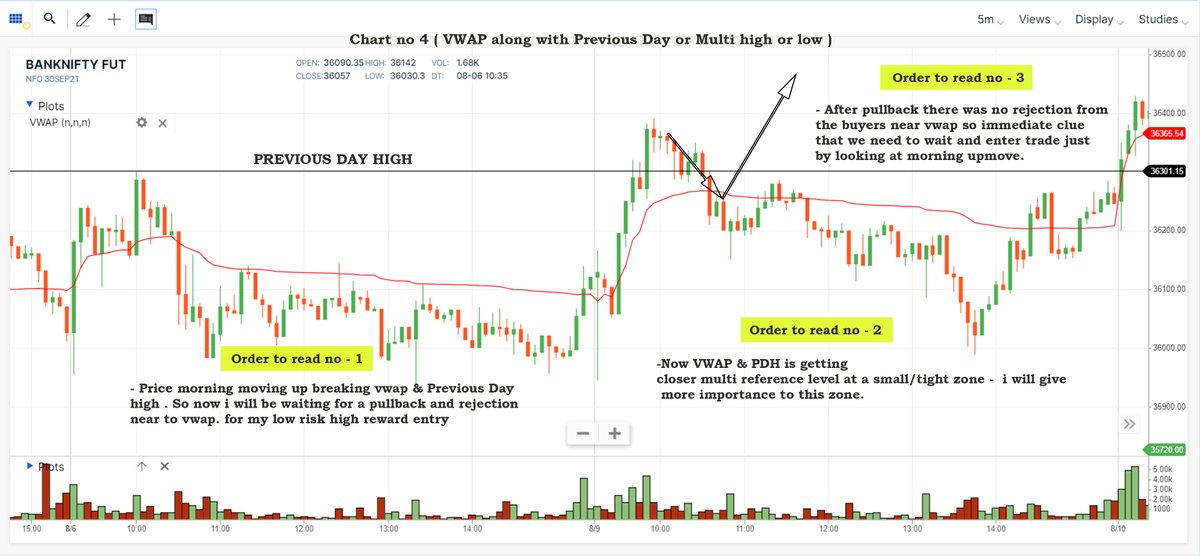
Chart 4
A small thread.
PART 1 - https://t.co/ooxepHpYKL
Traders show your support by like & retweet to benefit all
@Mitesh_Engr @ITRADE191 @ProdigalTrader @nakulvibhor @RajarshitaS @Puretechnicals9 @AnandableAnand @Anshi_________ @ca_mehtaravi
VWAP for intraday Trading Part -1
— Learn to Trade (@learntotrade365) August 28, 2021
A small thread PART -2 will be released tomorrow
Traders show your support by like & retweet to benefit all@Mitesh_Engr @ITRADE191 @ProdigalTrader @nakulvibhor @ArjunB9591 @CAPratik_INDIAN @RajarshitaS @Stockstudy8 @vivbajaj @Prakashplutus pic.twitter.com/y8bwisM4hB
Chart 1
Chart 2
Chart 3
Chart 4


You May Also Like

Speech Delay is most common in children nowadays
In ancient times, our grandparents used to follow typical natural way of caring the needs of a child. All they used were more of natural products than chemical based for the growth of child.

One of major step followed was to feed Gurbach Jadd/ Vasa Kommu/ Acorus Calamus for initiating good speech ability in a child. This stem was needed to babies on Tuesdays and Sundays in mother's milk.
Vasa is feed to baby after the 1st bath on 12th day in week. Weekly only thrice it is fed and named as :
Budhwar - Budhi Vasa
Mangalwar - Vaak Vasa
Ravi Vaar - Aayush Vasa
This stem is burnt and rubbed against the grinding stone in mother's milk or warm water to get a paste
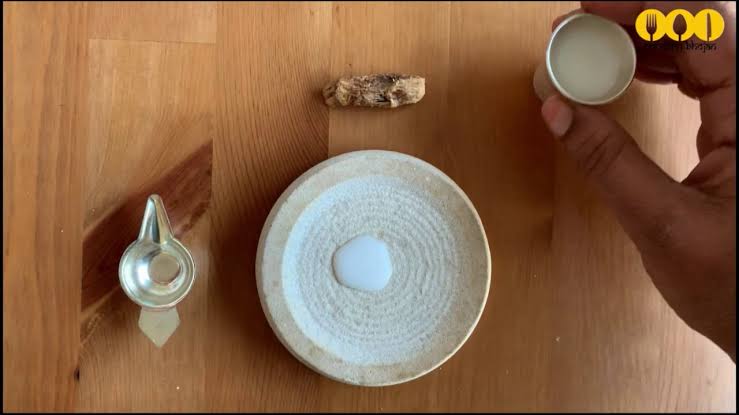
The procedure to make it is in the link
https://t.co/uo4sGp7mUm
It should not be given daily to the child. Other main benefits are
1. It clears the phlegm in child's throat caused due to continuous milk intake. It clears the tracts and breathing is effortless.
2. Digestion
For children who haven't got their speech and is delayed than usual should feed this vasa on these days in week atleast for 6months. Don't get carried away with this dialogue
"Some gain speech little late"
In ancient times, our grandparents used to follow typical natural way of caring the needs of a child. All they used were more of natural products than chemical based for the growth of child.
One of major step followed was to feed Gurbach Jadd/ Vasa Kommu/ Acorus Calamus for initiating good speech ability in a child. This stem was needed to babies on Tuesdays and Sundays in mother's milk.
Vasa is feed to baby after the 1st bath on 12th day in week. Weekly only thrice it is fed and named as :
Budhwar - Budhi Vasa
Mangalwar - Vaak Vasa
Ravi Vaar - Aayush Vasa
This stem is burnt and rubbed against the grinding stone in mother's milk or warm water to get a paste
The procedure to make it is in the link
https://t.co/uo4sGp7mUm
It should not be given daily to the child. Other main benefits are
1. It clears the phlegm in child's throat caused due to continuous milk intake. It clears the tracts and breathing is effortless.
2. Digestion
For children who haven't got their speech and is delayed than usual should feed this vasa on these days in week atleast for 6months. Don't get carried away with this dialogue
"Some gain speech little late"