
There are two major elements of the Indian economy.
An extensive yet super simple thread to understand the role of @RBI and how it uses 'Repo Rate' and 'Reverse Repo Rate' 👇🧵
You may bookmark this for further use.
#economy #RBI #financialliteracy
There are two major elements of the Indian economy.
They are the producers of the goods and services. Any business would be happy if it is growing and the prices of the goods and services sold are ever rising. They would be more interested in ‘Economic growth’.

It is the job of Reserve Bank of India to do this.
A. More the demand of any commodity, the businessman will increase the price. Less the demand of any commodity, the businessman will decrease the price to attract the consumers.


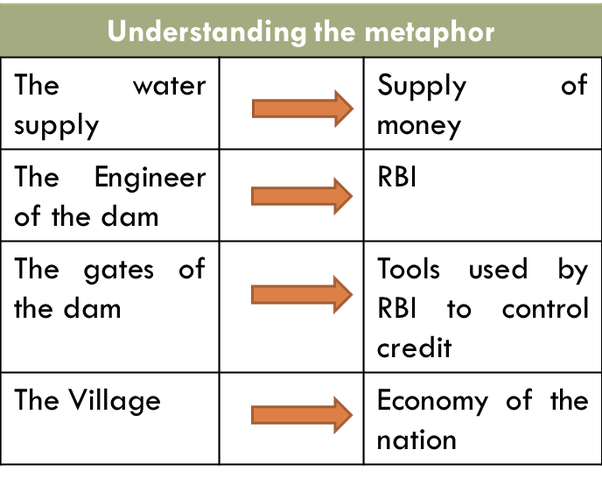
This can be done using various tools. Let us discuss 'Repo Rate' and 'Reverse Repo Rate' here.
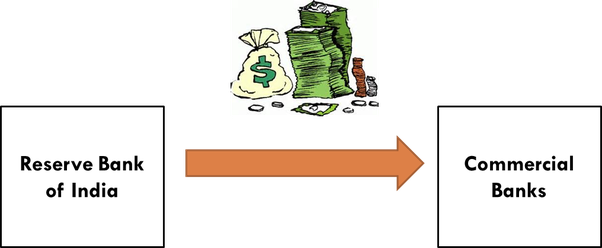
You go to a friend and ask for money, say 100 Rs. He don’t trust you so he asks you for security. You give him your watch as a security.
‘Reserve Bank of India’ decides the ‘Repo Rate’ and it changes it as and when needed keeping in mind the inflation and the growth factor of the economy.
👉 Decrease in ‘Repo Rate’ will make it easier for the Commercial Banks to lend money.
👉 Increased lending activity will cause an increase in the money supply.
👉 If RBI makes money supply easy then it will become very easy for commercial banks to lend loan to general public.
👉 Lending loan to general public in excess will cause increase in the supply of money in the hands of people.
👉 More money in the hands of people would imply more purchasing power.
👉 Increased purchasing power will lead to greater demand of goods and services. Hence, the prices will increase causing inflation to rise.
The rate at which commercial banks lend money to RBI is called as Reverse Repo Rate.
More from swapnilkabra


More from Finance

1/ I'm thrilled to announce the launch of my new website, a one-stop shop for all the content I'm creating.
There you'll find links to all my podcasts, the TTMYGH newsletter, and other exciting future projects.
2/ In 2020, I reignited my passion for interviewing brilliant people by launching The Grant Williams Podcast in various forms, including The End Game, The Super Terrific Happy Hour, and The Narrative Game.
3/ Starting February 1, I'm taking the bold step of moving these podcasts completely behind a paywall.
For the very affordable price of only $10 a month, listeners can gain access to the Copper Tier of https://t.co/fxUfH8maI4, which includes all current & future podcasts.

4/ Why am I doing this? First and foremost, I aspire to create VALUABLE content. By definition, if something is priced at $0, it isn’t valuable. The time, effort and creativity that goes into these episodes is substantial. To keep doing them properly, they can no longer be free.
5/ I also strongly believe content creators should be able to make a living creating content. If everything is free, that’s not possible. I never seriously considered accepting outside sponsors – complete integrity is too critical to me.
There you'll find links to all my podcasts, the TTMYGH newsletter, and other exciting future projects.
2/ In 2020, I reignited my passion for interviewing brilliant people by launching The Grant Williams Podcast in various forms, including The End Game, The Super Terrific Happy Hour, and The Narrative Game.
3/ Starting February 1, I'm taking the bold step of moving these podcasts completely behind a paywall.
For the very affordable price of only $10 a month, listeners can gain access to the Copper Tier of https://t.co/fxUfH8maI4, which includes all current & future podcasts.
4/ Why am I doing this? First and foremost, I aspire to create VALUABLE content. By definition, if something is priced at $0, it isn’t valuable. The time, effort and creativity that goes into these episodes is substantial. To keep doing them properly, they can no longer be free.
5/ I also strongly believe content creators should be able to make a living creating content. If everything is free, that’s not possible. I never seriously considered accepting outside sponsors – complete integrity is too critical to me.


You May Also Like


THREAD PART 1.
On Sunday 21st June, 14 year old Noah Donohoe left his home to meet his friends at Cave Hill Belfast to study for school. #RememberMyNoah💙

He was on his black Apollo mountain bike, fully dressed, wearing a helmet and carrying a backpack containing his laptop and 2 books with his name on them. He also had his mobile phone with him.
On the 27th of June. Noah's naked body was sadly discovered 950m inside a storm drain, between access points. This storm drain was accessible through an area completely unfamiliar to him, behind houses at Northwood Road. https://t.co/bpz3Rmc0wq
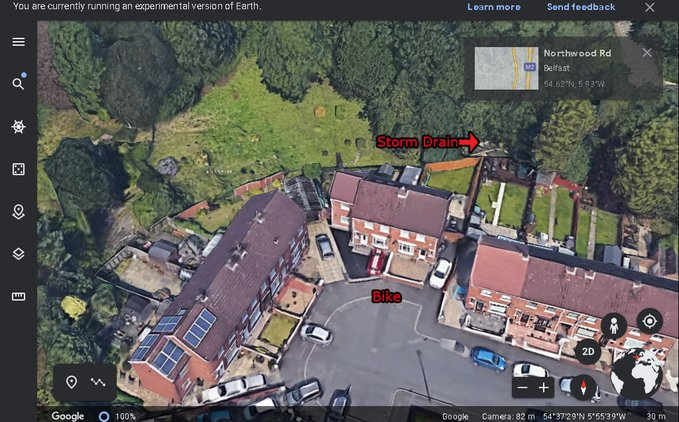
"Noah's body was found by specially trained police officers between two drain access points within a section of the tunnel running under the Translink access road," said Mr McCrisken."
Noah's bike was also found near a house, behind a car, in the same area. It had been there for more than 24 hours before a member of public who lived in the street said she read reports of a missing child and checked the bike and phoned the police.
On Sunday 21st June, 14 year old Noah Donohoe left his home to meet his friends at Cave Hill Belfast to study for school. #RememberMyNoah💙
He was on his black Apollo mountain bike, fully dressed, wearing a helmet and carrying a backpack containing his laptop and 2 books with his name on them. He also had his mobile phone with him.
On the 27th of June. Noah's naked body was sadly discovered 950m inside a storm drain, between access points. This storm drain was accessible through an area completely unfamiliar to him, behind houses at Northwood Road. https://t.co/bpz3Rmc0wq
"Noah's body was found by specially trained police officers between two drain access points within a section of the tunnel running under the Translink access road," said Mr McCrisken."
Noah's bike was also found near a house, behind a car, in the same area. It had been there for more than 24 hours before a member of public who lived in the street said she read reports of a missing child and checked the bike and phoned the police.
