
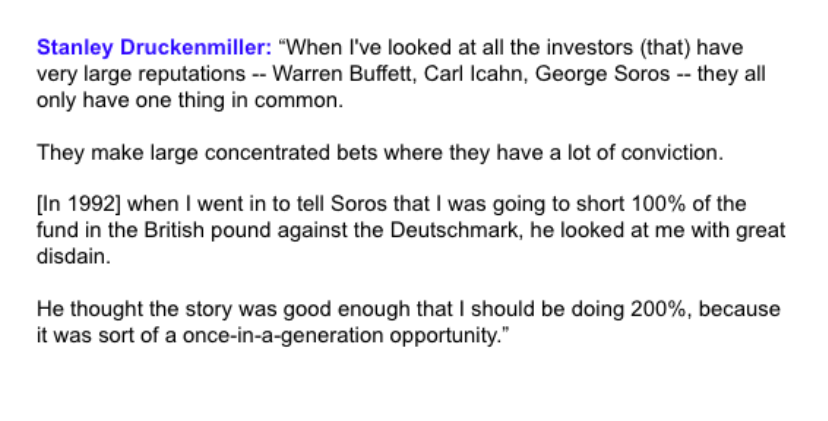
The most memorable interview I did this year was w/ Stanley Druckenmiller, who famously made $1B shorting the British Pound.
The trading legend's track record includes a 30-year stretch returning 30%+ a year (without a single down year).
Here are 8 investing lessons🧵


Follow @TrungTPhan to catch them in your feed.
Here's one you might like: https://t.co/B3SWUCF2cd
ASML is the most important company you've never heard of.
— Trung Phan \U0001f1e8\U0001f1e6 (@TrungTPhan) August 22, 2021
The $300B+ Dutch firm makes the machines that make semiconductors. Each one costs $150m and access to them are a huge geopolitical flashpoint.
Here's a breakdown \U0001f9f5 pic.twitter.com/pARj3x7Kwo
https://t.co/jGZs8brnVR
https://t.co/N7MqxWj2ks


More from Trung Phan 🇨🇦
The Wall Street Bets due diligence on Wendy’s is gold.
The catalysts are:
◻️ The release of a new summer salad
◻️ The @Wendys Twitter account, which has mastered “meta pragmatic roasting” (which is effective with younger people)
◻️ The fact it literally sells chicken tendies
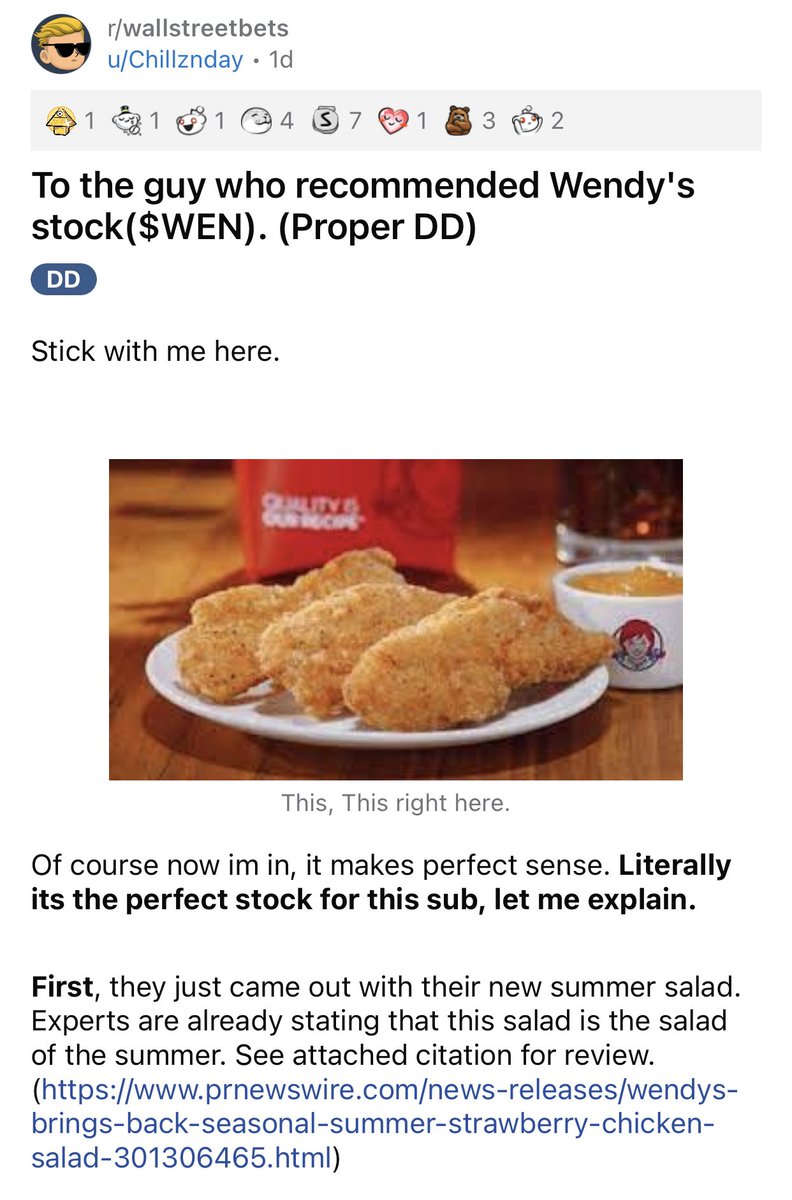
OP:
Here’s a more fundamentals-driven analysis of Wendy’s
https://t.co/A2k19S9M7J
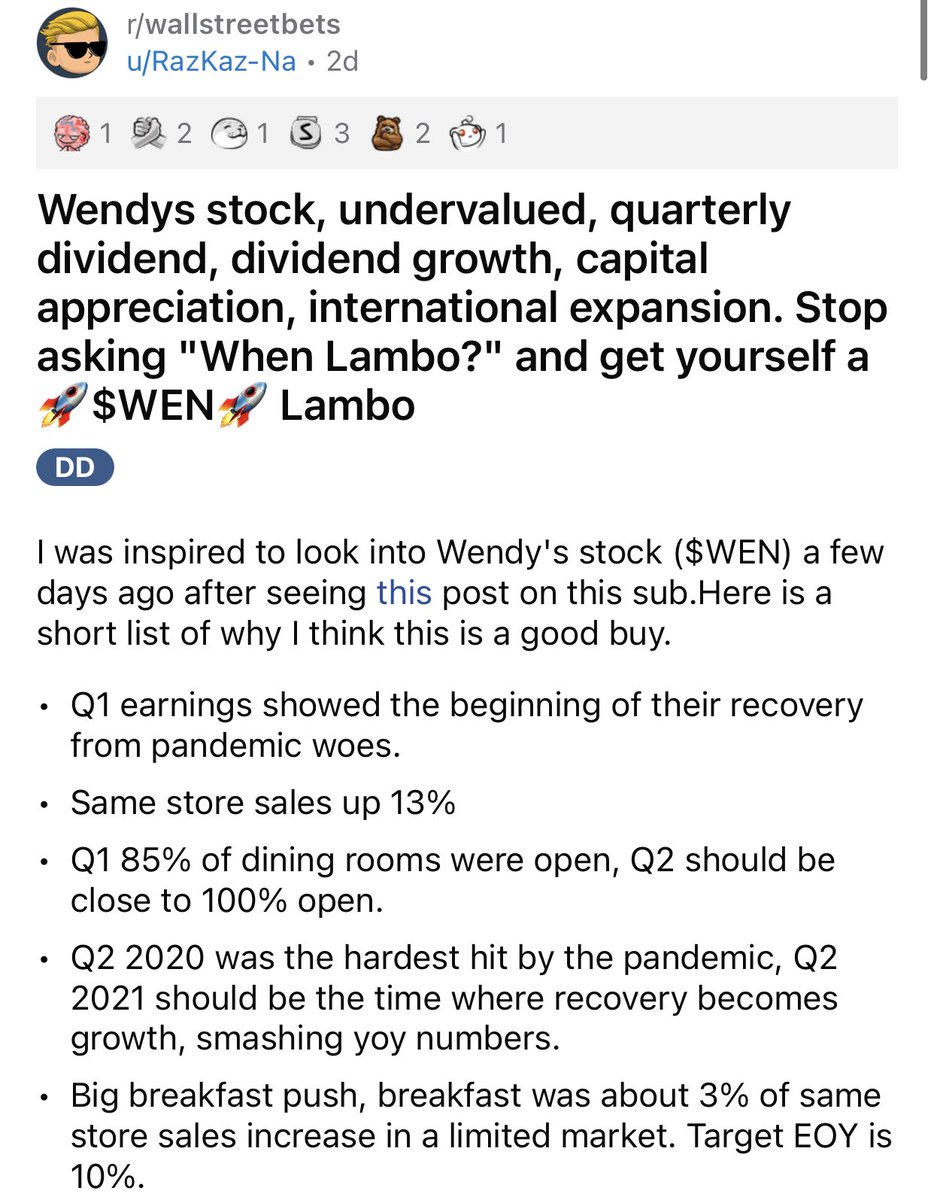
😂😂😂
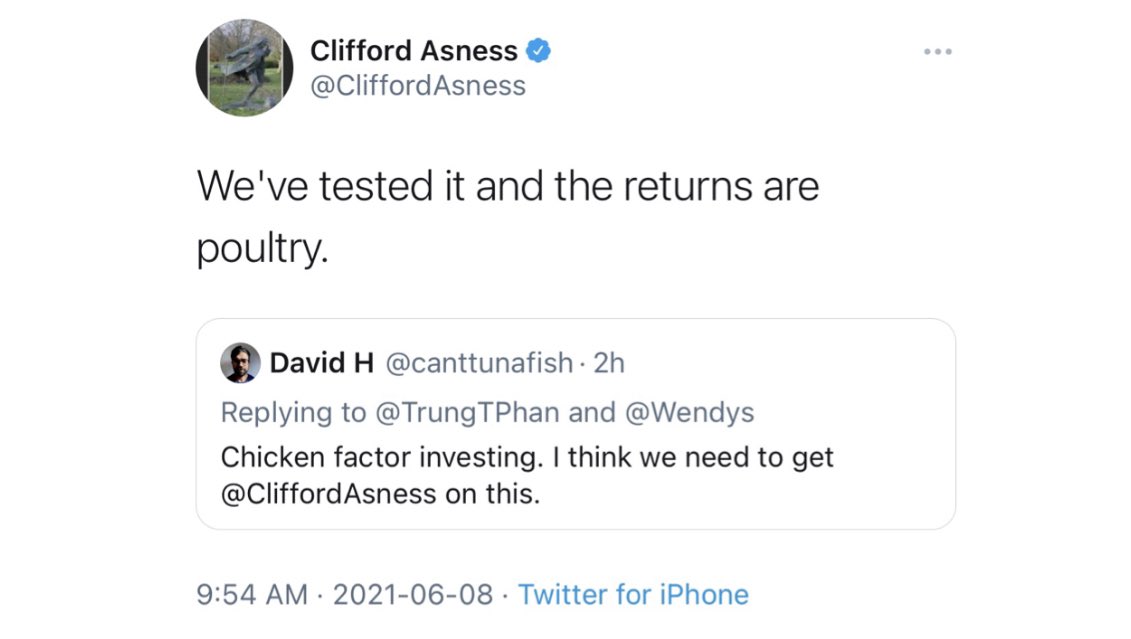
Further Wendy’s analysis from @CliffordAsness !!
The catalysts are:
◻️ The release of a new summer salad
◻️ The @Wendys Twitter account, which has mastered “meta pragmatic roasting” (which is effective with younger people)
◻️ The fact it literally sells chicken tendies
OP:
Here’s a more fundamentals-driven analysis of Wendy’s
https://t.co/A2k19S9M7J
😂😂😂
\u201cThe name of the company is Wendy\u2019s International $WEN. It is a cutting edge high tech firm out of rural Ohio that is awaiting imminent patent approval on the next generation of summer salads that have both huge military and civilian applications.\u201d pic.twitter.com/qmk4hkKL3N
— u/1ronyman (@1ronyman1) June 8, 2021
Further Wendy’s analysis from @CliffordAsness !!






More from Finance


THREAD: Who are the rising stars of Chinese elite politics in the central Party-State bureaucracy?
For @MacroPoloChina I analyzed last year's ministerial-level promotions to posts in Beijing
TLDR: Ties to Xi Jinping—or a Xi ally—are very helpful! (1/14)
https://t.co/kO2A0Efyq2
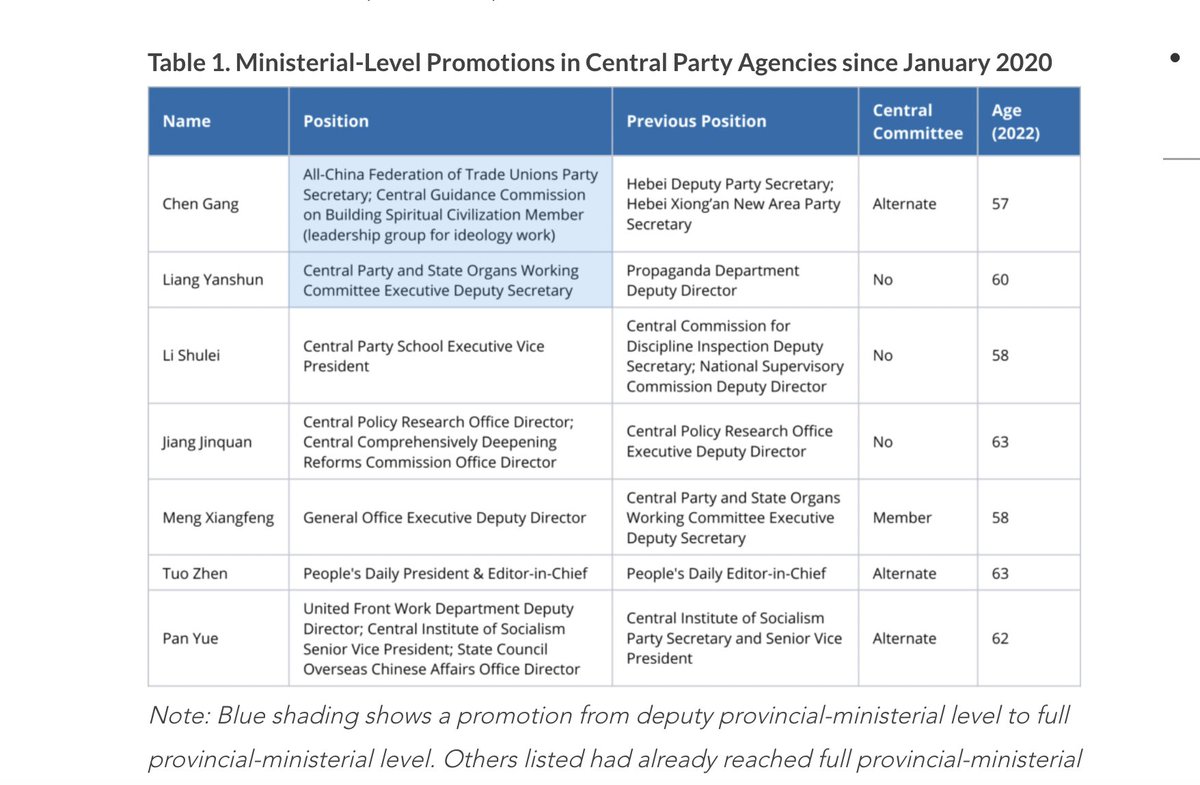
Seven politicians were promoted to ministerial-level positions in central Party agencies last year
All are likely to feature on the next Central Committee selected at the 2022 Party Congress
Some could make the CCP's elite 25-person Politburo (2/14)
https://t.co/kO2A0Efyq2
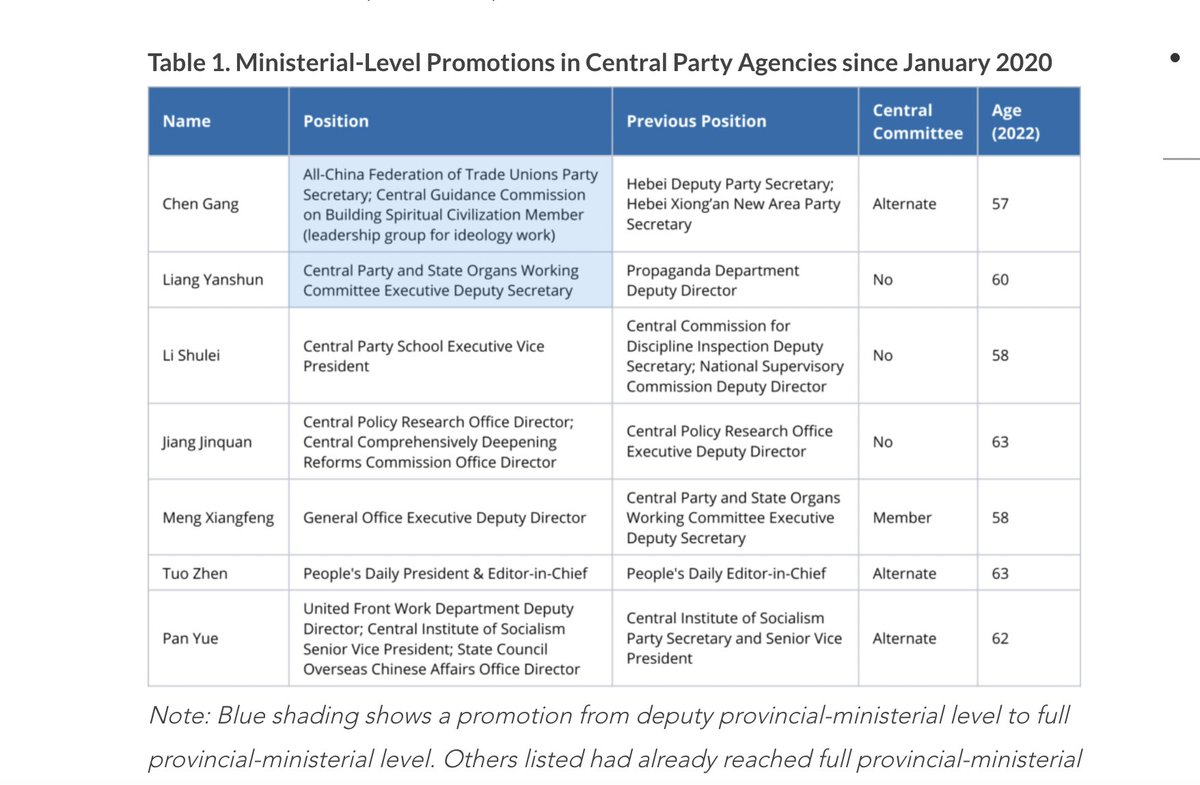
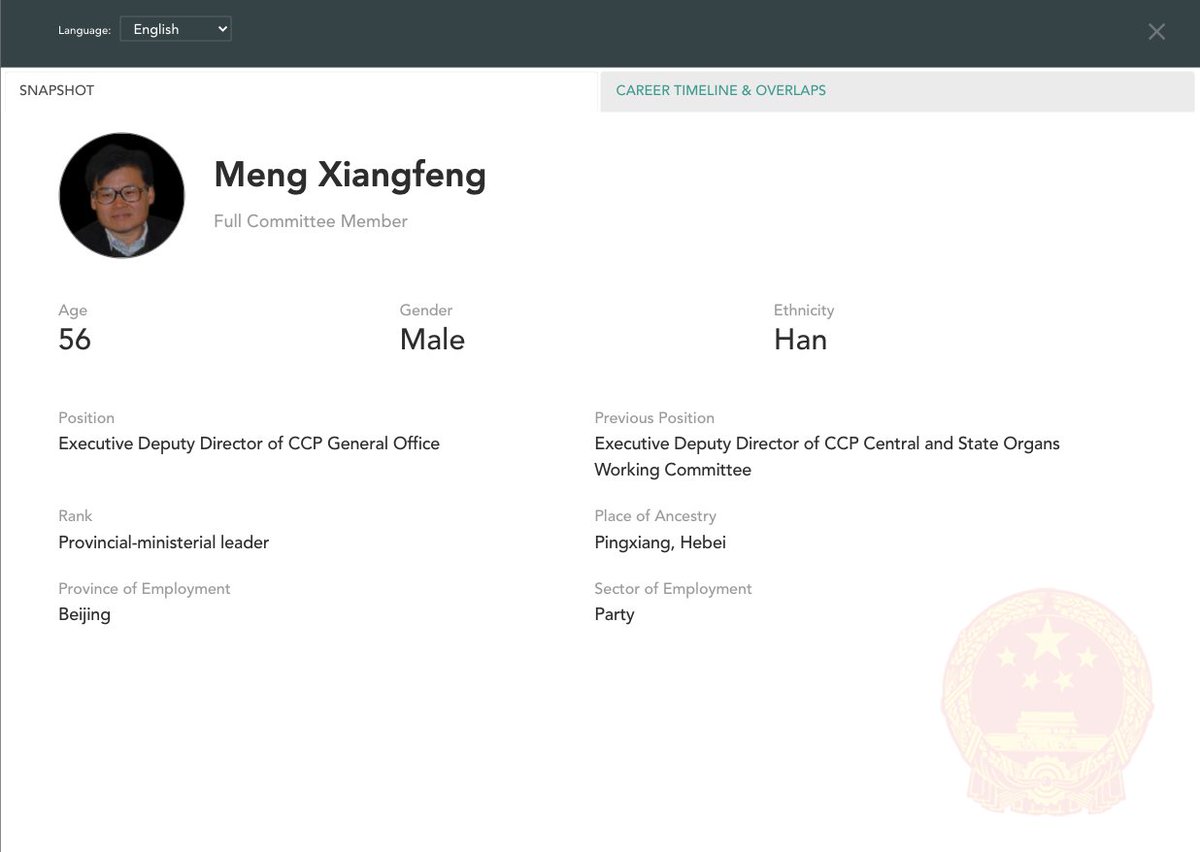
Likeliest for the Politburo is Meng Xiangfeng, new Executive Deputy Director of the CCP General Office
He would replace Xi ally Ding Xuexiang as CCP chief-of-staff if Ding is promoted further in 2022
Meng worked under Xi allies Cai Qi in Hangzhou and Chen Xi in Liaoning (3/14)
Less likely for the Politburo but still important is Jiang Jinquan, new Director of the CCP Policy Research Office
He replaces 5th-ranked leader Wang Huning who led the Party's brains trust for 18 years
Wang remains prominent and will be <68 in 2022, so he'll stay around (4/14)
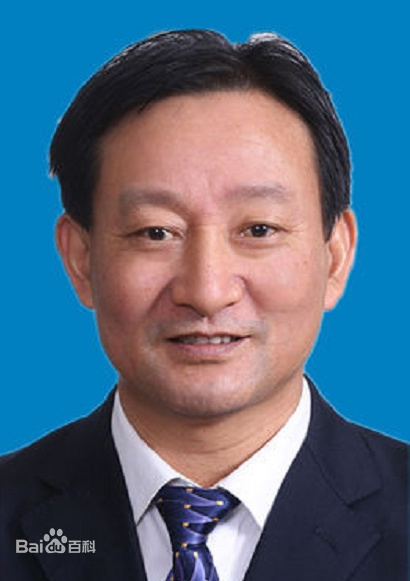
Other notable central Party promotions include Li Shulei and Liang Yanshun, who both assisted Xi when he led the Central Party School from 2007-2012
Li is a political conservative who is said to be quite close with Xi, even drafting his 2014 speech on culture and art (5/14)

For @MacroPoloChina I analyzed last year's ministerial-level promotions to posts in Beijing
TLDR: Ties to Xi Jinping—or a Xi ally—are very helpful! (1/14)
https://t.co/kO2A0Efyq2
Seven politicians were promoted to ministerial-level positions in central Party agencies last year
All are likely to feature on the next Central Committee selected at the 2022 Party Congress
Some could make the CCP's elite 25-person Politburo (2/14)
https://t.co/kO2A0Efyq2
Likeliest for the Politburo is Meng Xiangfeng, new Executive Deputy Director of the CCP General Office
He would replace Xi ally Ding Xuexiang as CCP chief-of-staff if Ding is promoted further in 2022
Meng worked under Xi allies Cai Qi in Hangzhou and Chen Xi in Liaoning (3/14)
Less likely for the Politburo but still important is Jiang Jinquan, new Director of the CCP Policy Research Office
He replaces 5th-ranked leader Wang Huning who led the Party's brains trust for 18 years
Wang remains prominent and will be <68 in 2022, so he'll stay around (4/14)
Other notable central Party promotions include Li Shulei and Liang Yanshun, who both assisted Xi when he led the Central Party School from 2007-2012
Li is a political conservative who is said to be quite close with Xi, even drafting his 2014 speech on culture and art (5/14)

Having made over 1000 boxes for vulnerable families in Cambridge via @RedHenCambridge (thanks to our customers 🙏🏽) My thoughts on the £30 box thing. Lots of factors at play here. 1/
If the pics in this @BootstrapCook thread are true and correct then the Govt/taxpayers & families in need are getting absolutely SHAFTED 👇🏽 2/
There are some mitigating circumstances. A £30 box won’t ever contain £30 (retail) worth of food - people aren’t factoring in
-the cost of the box
-paying someone to fill it
-rent & rates
-& most expensive the *transport/distribution*
3/
If you’re doing the above at scale. Delivering *across the UK* it’s not cheap BUT IMHO there should be at LEAST £20 worth of groceries in a £30 box. To get more value they need more fresh produce. Just carrots & apples is terrible. 4/
I’m gonna put my rep on the line here & say something about these big national catering companies whose names I’ve seen mentioned. They are an ASSHOLE to deal with & completely shaft small businesses like mine with their terms which is why I won’t deal with them. 5/
If the pics in this @BootstrapCook thread are true and correct then the Govt/taxpayers & families in need are getting absolutely SHAFTED 👇🏽 2/
Hi all. I\u2019ve been sent LOTS of photos of the food parcels that have replaced the \xa330 vouchers and asked what I would do with them. I\u2019m replying with advice privately because to do so publicly would look like justifying these ill thought through, offensively meagre scraps /1.
— Jack Monroe (@BootstrapCook) January 11, 2021
There are some mitigating circumstances. A £30 box won’t ever contain £30 (retail) worth of food - people aren’t factoring in
-the cost of the box
-paying someone to fill it
-rent & rates
-& most expensive the *transport/distribution*
3/
If you’re doing the above at scale. Delivering *across the UK* it’s not cheap BUT IMHO there should be at LEAST £20 worth of groceries in a £30 box. To get more value they need more fresh produce. Just carrots & apples is terrible. 4/
I’m gonna put my rep on the line here & say something about these big national catering companies whose names I’ve seen mentioned. They are an ASSHOLE to deal with & completely shaft small businesses like mine with their terms which is why I won’t deal with them. 5/



You May Also Like

Recently, the @CNIL issued a decision regarding the GDPR compliance of an unknown French adtech company named "Vectaury". It may seem like small fry, but the decision has potential wide-ranging impacts for Google, the IAB framework, and today's adtech. It's thread time! 👇
It's all in French, but if you're up for it you can read:
• Their blog post (lacks the most interesting details): https://t.co/PHkDcOT1hy
• Their high-level legal decision: https://t.co/hwpiEvjodt
• The full notification: https://t.co/QQB7rfynha
I've read it so you needn't!
Vectaury was collecting geolocation data in order to create profiles (eg. people who often go to this or that type of shop) so as to power ad targeting. They operate through embedded SDKs and ad bidding, making them invisible to users.
The @CNIL notes that profiling based off of geolocation presents particular risks since it reveals people's movements and habits. As risky, the processing requires consent — this will be the heart of their assessment.
Interesting point: they justify the decision in part because of how many people COULD be targeted in this way (rather than how many have — though they note that too). Because it's on a phone, and many have phones, it is considered large-scale processing no matter what.
It's all in French, but if you're up for it you can read:
• Their blog post (lacks the most interesting details): https://t.co/PHkDcOT1hy
• Their high-level legal decision: https://t.co/hwpiEvjodt
• The full notification: https://t.co/QQB7rfynha
I've read it so you needn't!
Vectaury was collecting geolocation data in order to create profiles (eg. people who often go to this or that type of shop) so as to power ad targeting. They operate through embedded SDKs and ad bidding, making them invisible to users.
The @CNIL notes that profiling based off of geolocation presents particular risks since it reveals people's movements and habits. As risky, the processing requires consent — this will be the heart of their assessment.
Interesting point: they justify the decision in part because of how many people COULD be targeted in this way (rather than how many have — though they note that too). Because it's on a phone, and many have phones, it is considered large-scale processing no matter what.


fascinated by this man, mario cortellucci, and his outsized influence on ontario and GTA politics. cortellucci, who lives in vaughan and ran as a far-right candidate for the italian senate back in 2018 - is a major ford donor...
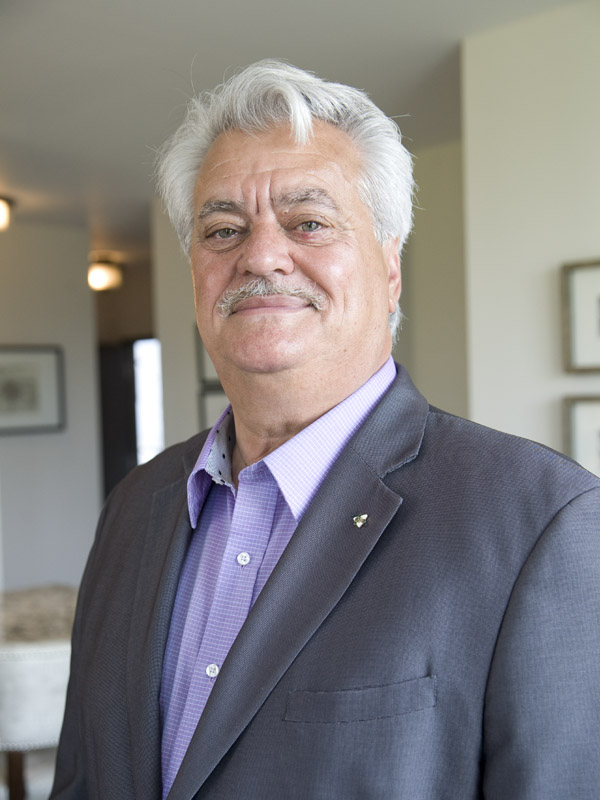
his name might sound familiar because the new cortellucci vaughan hospital at mackenzie health, the one doug ford has been touting lately as a covid-centric facility, is named after him and his family
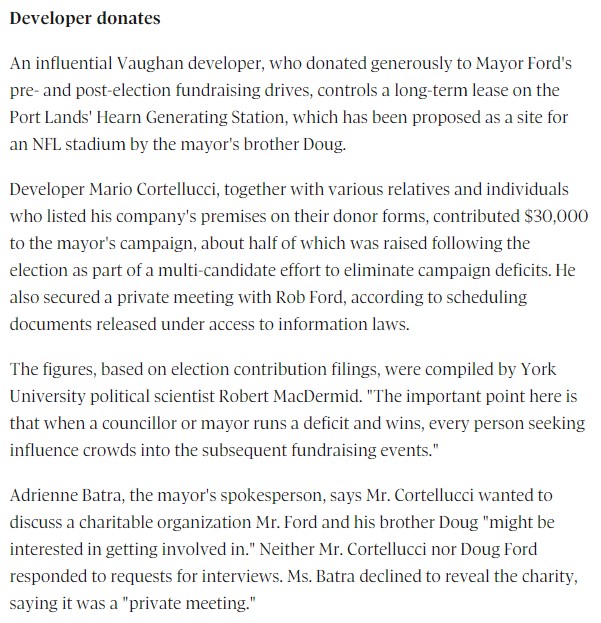
but his name also pops up in a LOT of other ford projects. for instance - he controls the long term lease on big parts of toronto's portlands... where doug ford once proposed building an nfl stadium and monorail... https://t.co/weOMJ51bVF
cortellucci, who is a developer, also owns a large chunk of the greenbelt. doug ford's desire to develop the greenbelt has been
and late last year he rolled back the mandate of conservation authorities there, prompting the resignations of several members of the greenbelt advisory
his name might sound familiar because the new cortellucci vaughan hospital at mackenzie health, the one doug ford has been touting lately as a covid-centric facility, is named after him and his family
but his name also pops up in a LOT of other ford projects. for instance - he controls the long term lease on big parts of toronto's portlands... where doug ford once proposed building an nfl stadium and monorail... https://t.co/weOMJ51bVF
cortellucci, who is a developer, also owns a large chunk of the greenbelt. doug ford's desire to develop the greenbelt has been
and late last year he rolled back the mandate of conservation authorities there, prompting the resignations of several members of the greenbelt advisory