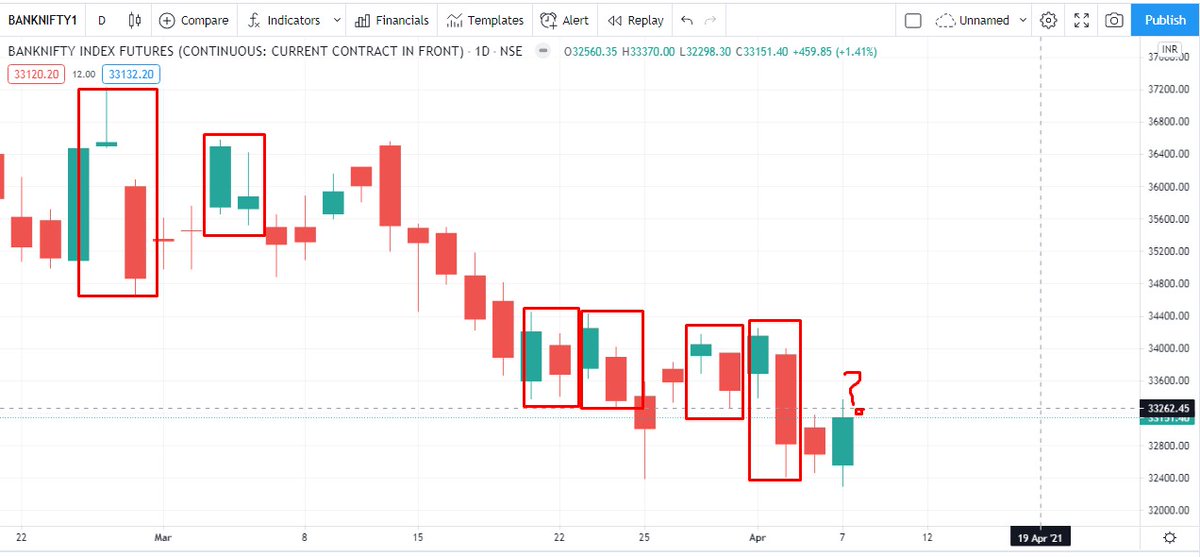
In technical analysis, majority of the patterns were first observed visually and then the rules made. Observing this interesting phenomenon on BNF over the past one month.
Any strong up day on BNF is immediately followed by a gap down open from the previous closing
Technical analysis of stock trends by Edwards and Magee
https://t.co/O8yWYpWC2W
More from Subhadip Nandy
Ok here is the explanation. Grab a cup of coffee and read on. If you have not read/noticed this, you will see intraday options movement in a new light.
Say we have two options, one 50 delta ATM options and another 30 delta OTM option. Normally for a 100 point move, the ATM option will move 50 points and the OTM option will move 30 points. But in a high volatile environment, the OTM option will also move nearly 50 points
To understand why this happens, first understand why an ATM option is 50 delta. An ATM option has the probability of 50% of expiring as ITM. The price just has to close a rupee above the strike for the CE to be ITM and vice versa for PEs
Now think of a highly volatile day like today. If someone is asked where the BNF will close for the day or expiry, no one can answer. BNF can close freakin anywhere, That makes every option of an equal probability of being ITM. So all options have a 50% probability of being ITM
Hence, when a huge volatile move starts, all OTM options behave like ATM options. This phenomenon was first observed in the Black Monday crash of 1987 at Wall Street, which also gave rise to the volatility skew/smirk
In a high IV environment or when the market is very volatile
— Subhadip Nandy (@SubhadipNandy16) January 21, 2022
" OTM options will behave like ATM options", one will get almost the same delta movement
Say we have two options, one 50 delta ATM options and another 30 delta OTM option. Normally for a 100 point move, the ATM option will move 50 points and the OTM option will move 30 points. But in a high volatile environment, the OTM option will also move nearly 50 points
To understand why this happens, first understand why an ATM option is 50 delta. An ATM option has the probability of 50% of expiring as ITM. The price just has to close a rupee above the strike for the CE to be ITM and vice versa for PEs
Now think of a highly volatile day like today. If someone is asked where the BNF will close for the day or expiry, no one can answer. BNF can close freakin anywhere, That makes every option of an equal probability of being ITM. So all options have a 50% probability of being ITM
Hence, when a huge volatile move starts, all OTM options behave like ATM options. This phenomenon was first observed in the Black Monday crash of 1987 at Wall Street, which also gave rise to the volatility skew/smirk
IV - A thread
In financial mathematics, implied volatility of an option contract is
that value of the volatility of the underlying instrument which, when
input in an option pricing model ) will return a theoretical value equal to the current market price of the option (1/n)
Implied volatility, a forward-looking and subjective measure, differs
from historical volatility because the latter is calculated from known
past returns of a security. .
https://t.co/iC5wVf7kvj (2/n)
To understand where Implied Volatility stands in terms of the underlying, implied volatility rank is used to understand its implied volatility from a one year high and low IV.
https://t.co/NFPOidRRcH
https://t.co/qNqinEqaKY
(3/n)
Options traders are always looking at the IV and IVR/IVP. For option
buyers, a low IV environment is best to initiate positions as the
subsequent rise in IV actually helps their positions . Even if the IV
remains flat, the position is not hurt by volatility (4/n)
Option sellers on the other hand are looking for high IV scenarios, where
the subsequent fall in IV ( known a vol crush , most often seen after
earnings/events) helps their positions. Here also, if the IV does not
rise, it does not hurt a seller's positions (5/n)