It shows how efficiently an organization is operating.
Ratio = EBDITA / Net Sales
EBITDA = Operating Income (EBIT) + Depreciation + Amortization
EBDITA Margin of 10% and more is considered good.
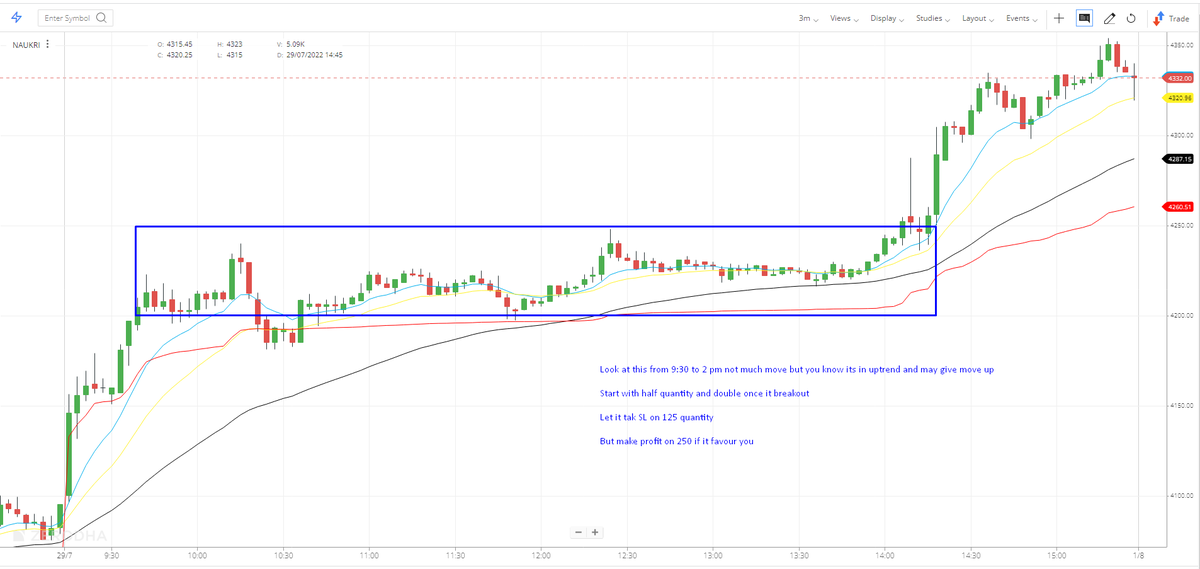
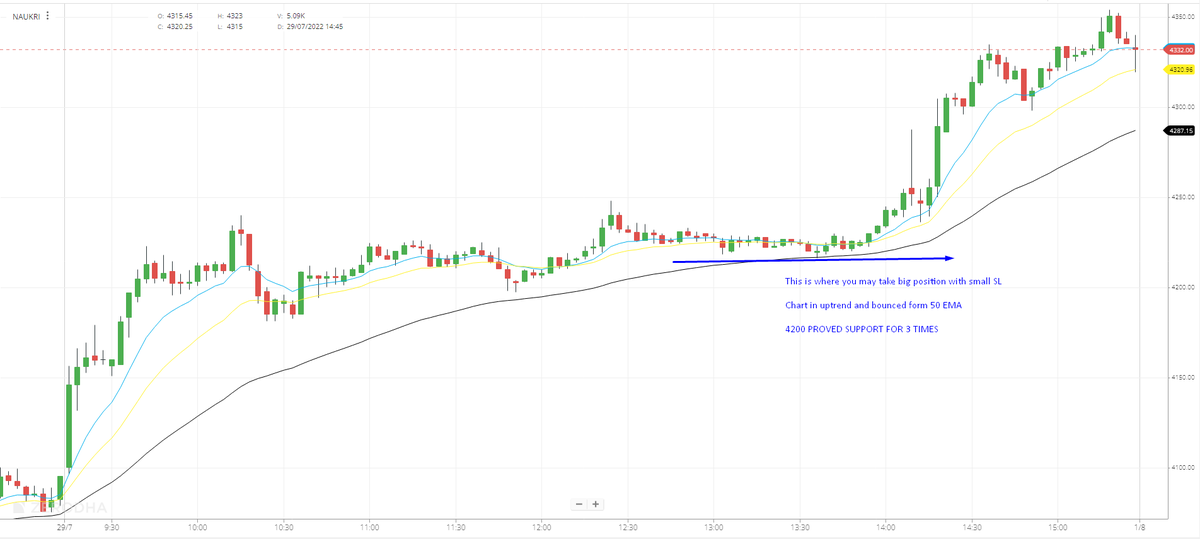
Time Frame importance -
— My First Stock (@myfirststock99) May 14, 2022
1) 3 min - For Execution
( indicators provide early signals and less reliable)
2) 15 min - to look at trend of week, Support and Resistance of last 4-5 days
3) Daily - to check current trend and Short Term S-R (More reliability)
Charts - pic.twitter.com/SWHcQQ8m0F
Candlesticks are Base for Analysis of Charts
— My First Stock (@myfirststock99) August 15, 2022
Here are the 10 Candlestick patterns you must know
A Thread \U0001f9f5\U0001f9f5
Kindly Re-Tweet for Max Reach
How to create Screeners on Trading View
— My First Stock (@myfirststock99) October 15, 2022
A Thread \U0001f9f5\U0001f9f5
Gold standard info if you can integrate for intraday
Kindly Re-Tweet for Max Reach \U0001f64f
How to Create Screeners on Chart Ink
— My First Stock (@myfirststock99) May 28, 2022
A Thread with 10 Screeners\U0001f9f5\U0001f9f5\U0001f9f5
Kindly Re-Tweet Like for Max Reach
Lets Help \U0001f64f
How to Find Multibagger Stocks
— My First Stock (@myfirststock99) August 27, 2022
How to create screeners and use them
How to read charts \U0001f9f5\U0001f9f5
A thread of all my Threads
Kindly Re-Tweet to help others \U0001f64f

One of the oddest features of the Labour tax row is how raising allowances, which the media allowed the LDs to describe as progressive (in spite of evidence to contrary) through the coalition years, is now seen by everyone as very right wing
— Tom Clark (@prospect_clark) November 2, 2018