
Ex: The closer we get to moving at the speed of light, the more we slow down.
It looks like every symptom on Google search leads to cancer.
So, when you have a symptom that Google screams CANCER, should you be afraid?
Before I answer that for you, let's talk about Occam's Razor and how you can use it to simplify your life.
Let's dive in. 👇👇👇
Ex: The closer we get to moving at the speed of light, the more we slow down.
One suggested that the phenomenon was due to the changes that took place within "the ether". Another didn't refer to the ether at all.
The former was the physicist named Lorentz.
The latter was Einstein.
This was the Einstein-Lorentz Relativity priority dispute that we are talking about.
Einstein used no references to the ether, and his simpler explanation rooted in scientific method won.
Occam's Razor is a philosophical tool, a mental model used in problem solving.
What does it say?
"Entities should not be multiplied without necessity"
In other words,
"The simplest explanation is usually the right one".
It helps shave off unnecessary, unlikely explanations and factors from explanations.
Whenever you have a hypothesis with two competing explanations, the simpler explanation is the most likely to be the valid one.
A version of Occam's Razor, "The Zebra" suggests you reject an exotic medical diagnosis when a more commonplace explanation is more likely.
"When you hear hoofbeats, think of horses not zebras"
A simpler explanation might say it's common cold or dehydration.
Which one is more likely to be valid? The simpler one.
Let's first understand the two principles that constitute the razor.
i) Plurality should not be posited without necessity
ii)It is pointless to do with more what is done with less
You wouldn't use 3 men to do a one man's job. It's a waste of resources.
You wouldn't have 2 jobs, if you get a job that pays the equivalent of two.
- You clean up your desk.
- No need for 5 monitors. One or two would do.
- You reduce your inputs for trading (news, media, TV, online forums).
Because of this, you're often drawn to complex answers/solutions to succeed in them.
That's why complicated systems, indicators, workshops are all popular.
Very few believe simple things work.
While this might get you a better backtest result, it will often result in the system not working in real time.
The more the optimization, the more curve fitted the system to data.
Complex systems are usually fragile.
As the number of parameters grow linearly, complexity grows exponentially.

Simpler concepts and simpler rules based on fundamental market principles work.
They are also less likely to change in future.
- Twitter chatter, trends
- NSE announcements page
- Bloomberg, CNBC, Moneycontrol
and many other sources while trading.
Sometimes with these sources providing conflicting information, you can't even trade.

You get all the information you need from the charts itself.
At worst, you'd need only one good news source to take your decisions.
More knowledge won't bring more success beyond a point.
In fact, it's highly correlated to detrimental returns.
Your returns increase proportional to effort/time/resources invested up to a certain point.
Beyond that, the returns diminish.
We see this phenomenon everywhere.

Above a certain net-worth number (say $100M), life doesn't get any better in proportion to extra money.
Likewise, doing more doesn't mean achieving more in proportion, beyond a certain point.
- Fewer/no indicators (naked charts)
- Less tweaking in backtests
- Maximum one or two instruments traded
- Cut off news, twitter, TV during trading hours.
Owning 5-6 mutual funds, you end up having overlapping stocks across funds.
You end up owning over 200 stocks, getting returns that are worse than the index.
Either go for one or two multicap/hybrid funds, or do passive index investing.
One may want you to move to cash.
Another may tell you to invest more.
Another would tell you to liquidate and put everything into gold/real estate.
Which one do you listen to?
Find one financial advisor who understands your risk metrics, your financial goals, and tailors a plan for you.
That is more often enough to go after your financial goals in the most sustainable manner.
That doesn't make the process any better, only more complicated.
Keeping it simple and sticking to optimal number of inputs is important.
A simple process or system is not easy to develop.
It takes effort, probably years to develop a simple process that's robust enough to use consistently.
There will be certain amount of complexity required to solve any problem, be it in anything.
We call this "intrinsic complexity".
So, the focus should be to avoid accidental complexity.
You must work with only the intrinsic complexity underlying any problem at hand. Avoid introducing accidental complexities.
More from Shravan Venkataraman 🔥🚀💰
Hedge Funds spend millions of dollars per year to access high quality financial datasets.
Retail sources cost anywhere from $5k-50k per year.
But, here are 11 data sources that have HIGH QUALITY and FREE data you can access right away.
🧵 👇
1/ Alpha Vantage | https://t.co/ExlS7Jdnsz
Provides real time & historical equities, forex, and cryptocurrencies data across 60+ exchanges.
They provide both intraday and D/W/M timeframe data.
You can also access economic & fundamental data for last 20 years through them.
2/ IEX | https://t.co/drqeoU8Ee1
Investors Exchange provides historical data going back upto 15 years for US equities through API access.
You'll need an API key in order to access the API.
3/ EconDB | https://t.co/6mZxDeaJfh
This website provides economic data and economic indicators for almost all the countries in the world.
You can search for your preferred dataset through their search engine here
4/ Quandl | https://t.co/fW4PEQaW66
Quandl has financial and alternate data across 50+ exchanges, from over 300 sources.
They also have information on capital markets, energy, shipping, healthcare, education, demography, economics and society.
In today's round up, I have some amazing threads, resources, and plenty of solid advice for business, finance, career from twitter.
Here's the roundup of 17 of the best and the most useful threads, tweets, and resources I found last week. 🧵
1/ How to find spreadsheets on any topic in the
2/ A thread by @wes_kao on making your customers hungry and excited to buy from
3/ Life brings you a lot of afflictions. But if you look around, there's a lot of beauty around you. Most often, drowning in the afflictions, we can't recognise or appreciate the beauty.
@wdmorrisjr wrote a damn good thread on finding beauty around us.
4/ This one is for all the job goers and job seekers.
@SahilBloom who recently hit 500k followers and has several accomplishments to his belt (career wise) wrote this thread on standing out in a hiring
Here's the roundup of 17 of the best and the most useful threads, tweets, and resources I found last week. 🧵
1/ How to find spreadsheets on any topic in the
How to find spreadsheets on any topic in the world:
— Blake Emal (@heyblake) February 13, 2022
1. Go to Google
2. Search site:docs(dot)Google(dot)com/spreadsheets \u201cYOUR TOPIC\u201d
3. Search, scroll, succeed pic.twitter.com/VJsYQKyi0J
2/ A thread by @wes_kao on making your customers hungry and excited to buy from
How to get customers excited, hungry to buy, and ready to say yes:
— Wes Kao \U0001f3db (@wes_kao) February 13, 2022
3/ Life brings you a lot of afflictions. But if you look around, there's a lot of beauty around you. Most often, drowning in the afflictions, we can't recognise or appreciate the beauty.
@wdmorrisjr wrote a damn good thread on finding beauty around us.
You\u2019re not looking for more success, stuff, or sex.
— David Morris (@wdmorrisjr) February 13, 2022
You\u2019re searching for beauty.
Here\u2019s how to find it: \U0001f9f5
4/ This one is for all the job goers and job seekers.
@SahilBloom who recently hit 500k followers and has several accomplishments to his belt (career wise) wrote this thread on standing out in a hiring
10 ways to stand out in a hiring process (that don\u2019t involve your resume):
— Sahil Bloom (@SahilBloom) February 13, 2022


More from Trading


𝗡𝗶𝗳𝘁𝘆-𝗕𝗮𝗻𝗸𝗻𝗶𝗳𝘁𝘆 𝗢𝗽𝘁𝗶𝗼𝗻 𝗕𝘂𝘆𝗶𝗻𝗴 𝗦𝘁𝗿𝗮𝘁𝗲𝗴𝘆
Complete Backtest and Indicator link
🧵 A Thread 🧵
𝗦𝗲𝘁𝘂𝗽:
🔸 Monthly Option Buying
🔸 50 ema on 3 min timeframe
🔸 Supertrend 10 , 3
🔸 Chart : Banknifty , Nifty Futures as we backtested on futures
🔸 Entry 9:20 to 3:00
🔸 Max 3 Entries per day
🔸 Premium nearest to 200 Rs only
[2/18]
Why Monthly Option buying ?
🔸 Less theta decay compared to weekly options
🔸 Less Volatility
🔸 Supertrend and MA Settings
[3/18]

🔸 Indicator Link
🔸 Click on the below 𝘭𝘪𝘯𝘬 -> 𝘈𝘥𝘥 𝘵𝘰 𝘍𝘢𝘷𝘰𝘶𝘳𝘪𝘵𝘦𝘴 -> 𝘈𝘥𝘥 𝘰𝘯 𝘊𝘩𝘢𝘳𝘵 from favourites and start using it !
🔸 https://t.co/zVXavqLBto
[4/18]
𝗜𝗻𝗱𝗶𝗰𝗮𝘁𝗼𝗿 𝗦𝗲𝘁𝘁𝗶𝗻𝗴𝘀 :
🔸 Max 6 Trades per day ( Both CE and PE buy)
🔸 Timings 9:20 am to 3:00 pm
🔸 Supertrend : 10,3
🔸 Moving Average 50 ema
[5/18]

Complete Backtest and Indicator link
🧵 A Thread 🧵
𝗦𝗲𝘁𝘂𝗽:
🔸 Monthly Option Buying
🔸 50 ema on 3 min timeframe
🔸 Supertrend 10 , 3
🔸 Chart : Banknifty , Nifty Futures as we backtested on futures
🔸 Entry 9:20 to 3:00
🔸 Max 3 Entries per day
🔸 Premium nearest to 200 Rs only
[2/18]
Why Monthly Option buying ?
🔸 Less theta decay compared to weekly options
🔸 Less Volatility
🔸 Supertrend and MA Settings
[3/18]
🔸 Indicator Link
🔸 Click on the below 𝘭𝘪𝘯𝘬 -> 𝘈𝘥𝘥 𝘵𝘰 𝘍𝘢𝘷𝘰𝘶𝘳𝘪𝘵𝘦𝘴 -> 𝘈𝘥𝘥 𝘰𝘯 𝘊𝘩𝘢𝘳𝘵 from favourites and start using it !
🔸 https://t.co/zVXavqLBto
[4/18]
𝗜𝗻𝗱𝗶𝗰𝗮𝘁𝗼𝗿 𝗦𝗲𝘁𝘁𝗶𝗻𝗴𝘀 :
🔸 Max 6 Trades per day ( Both CE and PE buy)
🔸 Timings 9:20 am to 3:00 pm
🔸 Supertrend : 10,3
🔸 Moving Average 50 ema
[5/18]


You May Also Like


THREAD: 12 Things Everyone Should Know About IQ
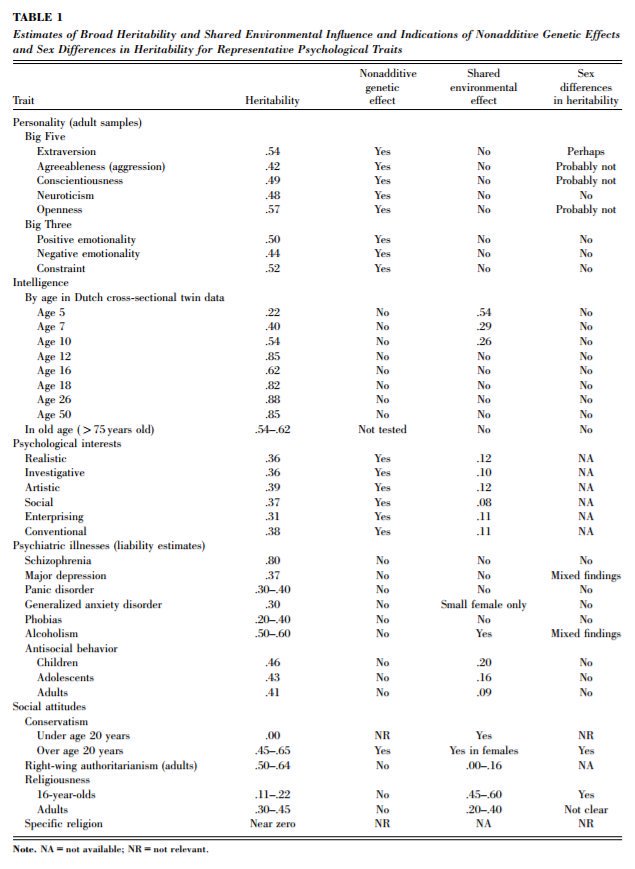
1. IQ is one of the most heritable psychological traits – that is, individual differences in IQ are strongly associated with individual differences in genes (at least in fairly typical modern environments). https://t.co/3XxzW9bxLE
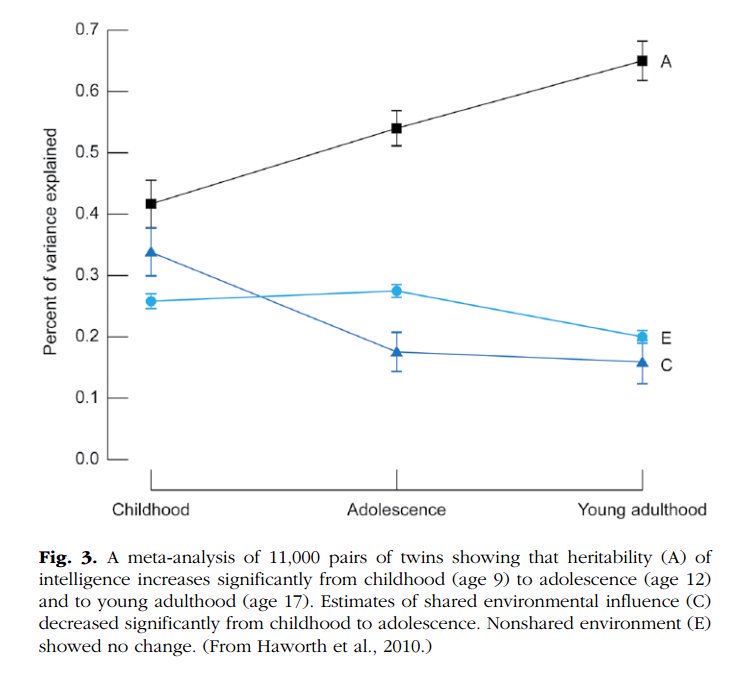
2. The heritability of IQ *increases* from childhood to adulthood. Meanwhile, the effect of the shared environment largely fades away. In other words, when it comes to IQ, nature becomes more important as we get older, nurture less. https://t.co/UqtS1lpw3n
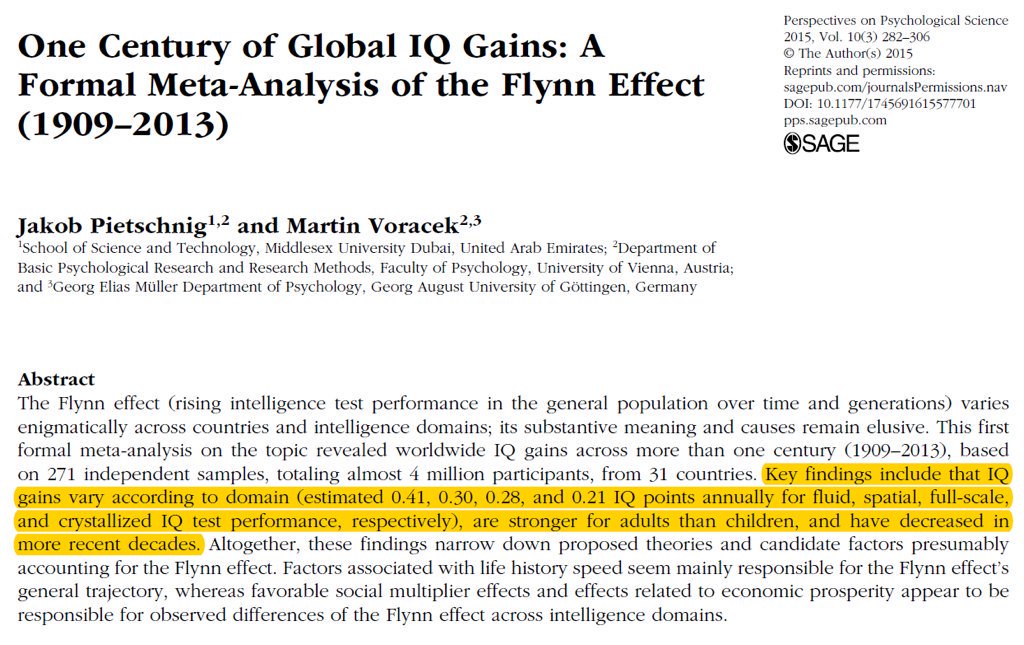
3. IQ scores have been increasing for the last century or so, a phenomenon known as the Flynn effect. https://t.co/sCZvCst3hw (N ≈ 4 million)
(Note that the Flynn effect shows that IQ isn't 100% genetic; it doesn't show that it's 100% environmental.)
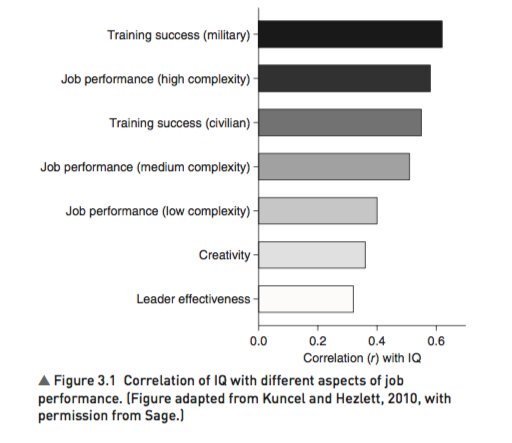
4. IQ predicts many important real world outcomes.
For example, though far from perfect, IQ is the single-best predictor of job performance we have – much better than Emotional Intelligence, the Big Five, Grit, etc. https://t.co/rKUgKDAAVx https://t.co/DWbVI8QSU3
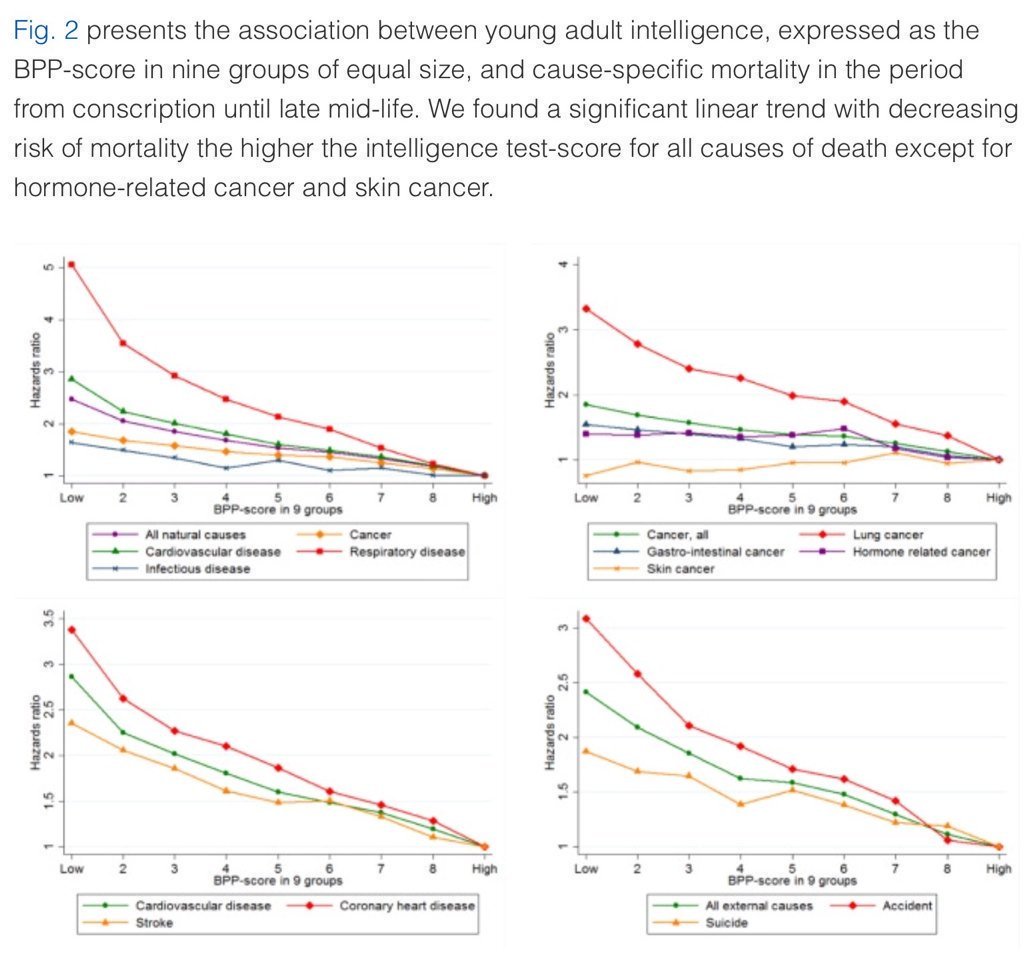
5. Higher IQ is associated with a lower risk of death from most causes, including cardiovascular disease, respiratory disease, most forms of cancer, homicide, suicide, and accident. https://t.co/PJjGNyeQRA (N = 728,160)
1. IQ is one of the most heritable psychological traits – that is, individual differences in IQ are strongly associated with individual differences in genes (at least in fairly typical modern environments). https://t.co/3XxzW9bxLE
2. The heritability of IQ *increases* from childhood to adulthood. Meanwhile, the effect of the shared environment largely fades away. In other words, when it comes to IQ, nature becomes more important as we get older, nurture less. https://t.co/UqtS1lpw3n
3. IQ scores have been increasing for the last century or so, a phenomenon known as the Flynn effect. https://t.co/sCZvCst3hw (N ≈ 4 million)
(Note that the Flynn effect shows that IQ isn't 100% genetic; it doesn't show that it's 100% environmental.)
4. IQ predicts many important real world outcomes.
For example, though far from perfect, IQ is the single-best predictor of job performance we have – much better than Emotional Intelligence, the Big Five, Grit, etc. https://t.co/rKUgKDAAVx https://t.co/DWbVI8QSU3
5. Higher IQ is associated with a lower risk of death from most causes, including cardiovascular disease, respiratory disease, most forms of cancer, homicide, suicide, and accident. https://t.co/PJjGNyeQRA (N = 728,160)