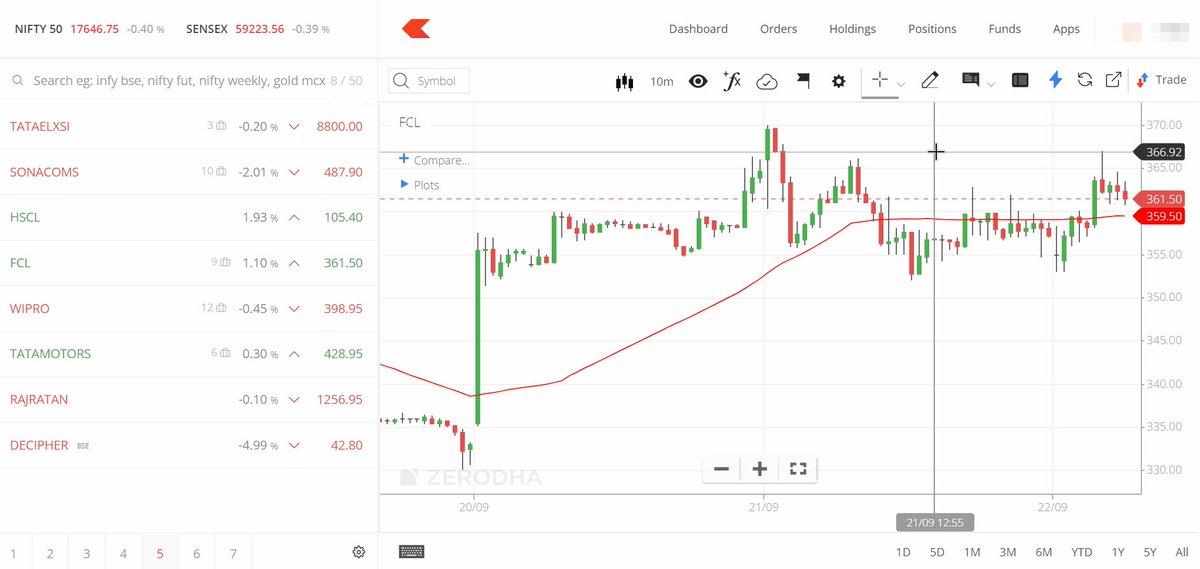
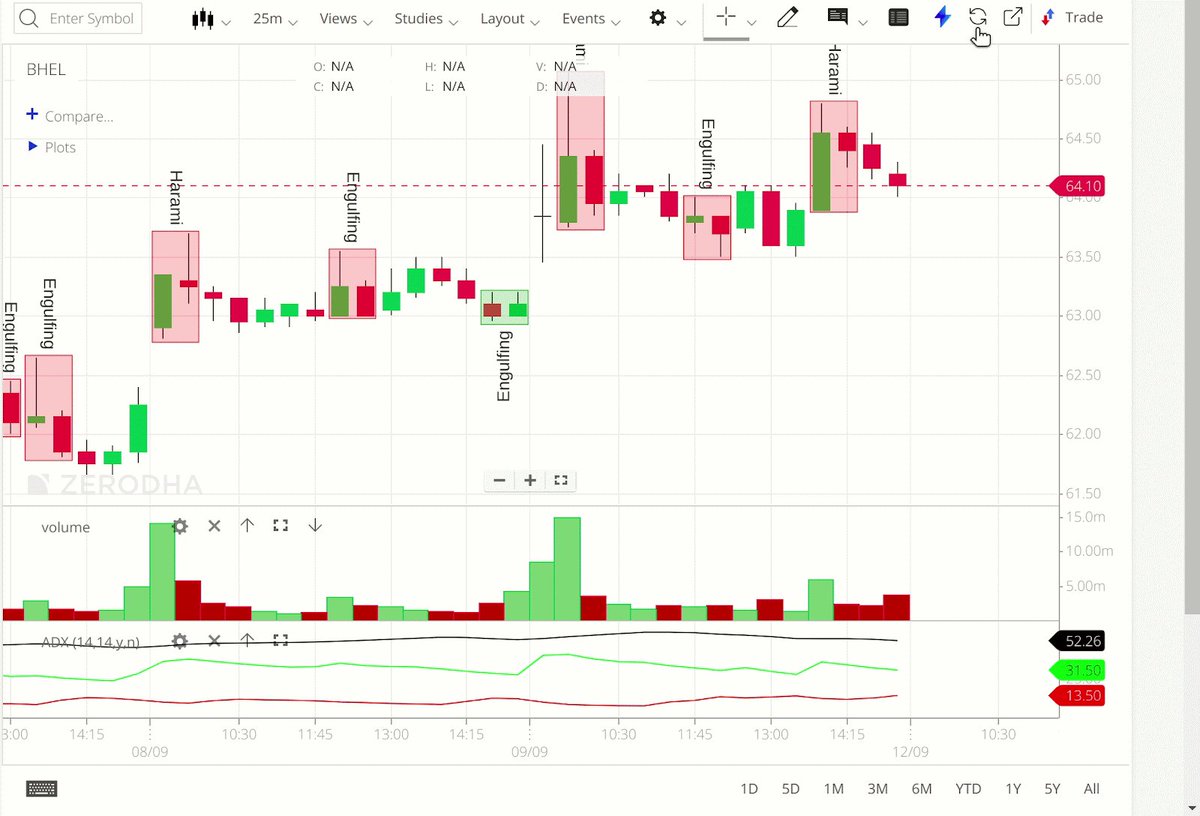
Charts with timeframes of 75 and 125 minutes were amongst the most popular feature requests. With the custom timeframe feature, you can now not only access 75 and 125-minute charts, but you can also do so for any timeframe of your choice.
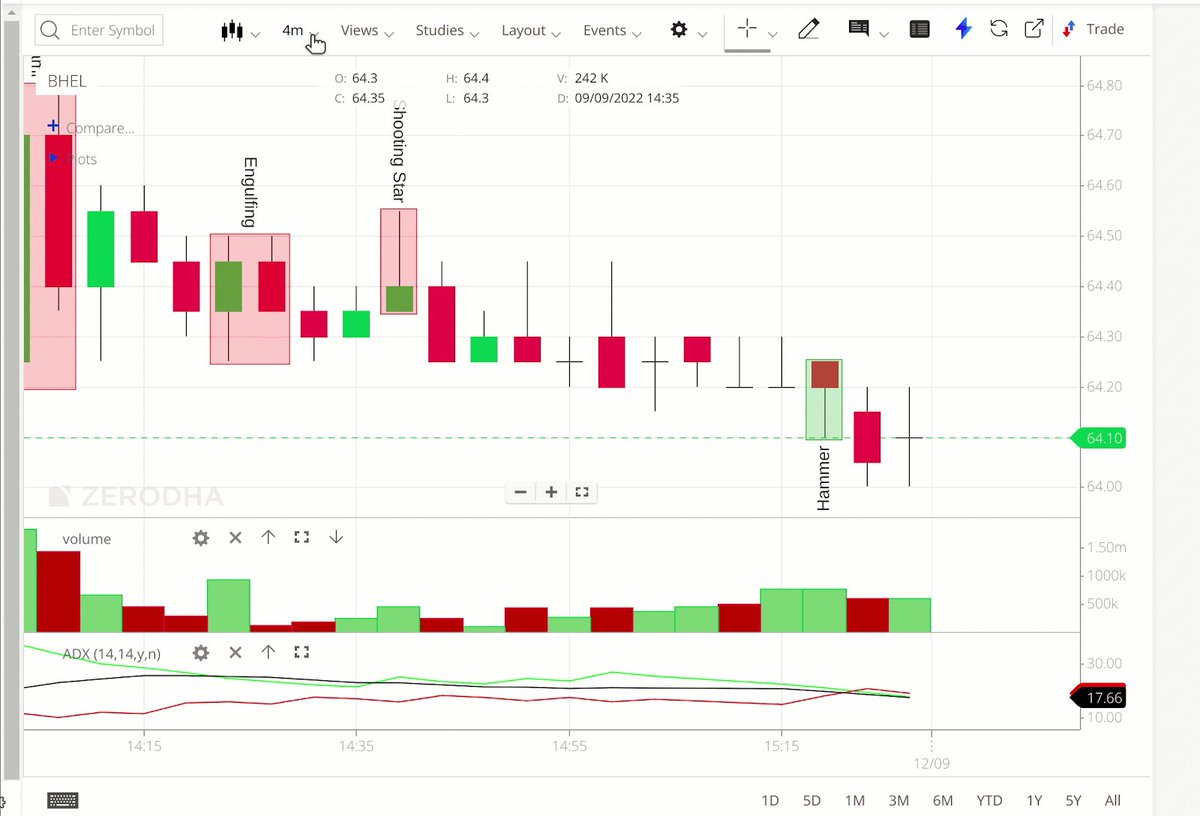
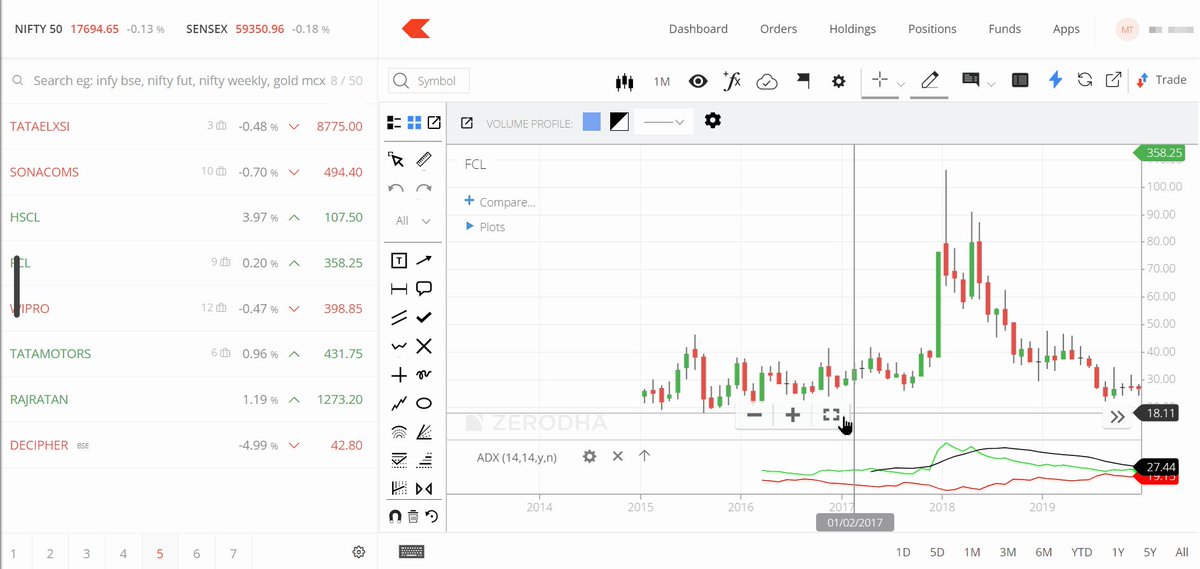
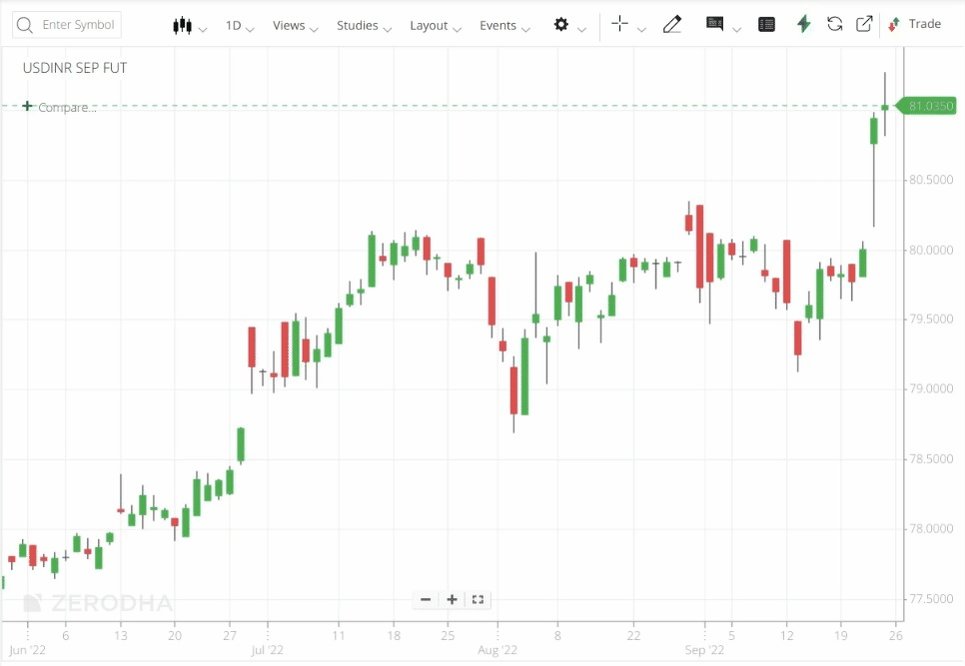
ChartIQ charts on Kite web just got an upgrade with custom timeframe charts, new indicators, backtesting from charts, and much more.
Here’s how you can switch to the new version of ChartIQ: https://t.co/rhXrQ330G7
A thread on all the new features 👇
Charts with timeframes of 75 and 125 minutes were amongst the most popular feature requests. With the custom timeframe feature, you can now not only access 75 and 125-minute charts, but you can also do so for any timeframe of your choice.
@StreakTech allows you to create and backtest trading strategies without any coding. Streak is now integrated with Kite charts. Clicking on the Streak icon will start a backtest of widely used strategies with the indicators applied on the charts.
Chart shortcuts are now available on ChartIQ 8. Shortcuts can be used to quickly perform actions such as invoking the order window, accessing drawing tools, zooming, etc.
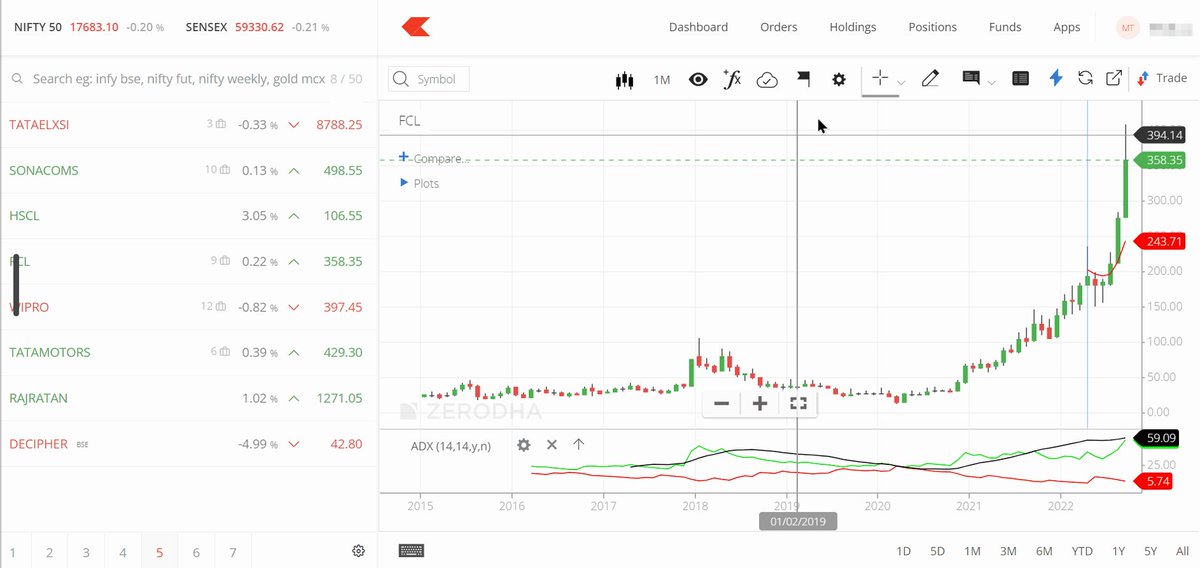
New indicators: Projected Aggregate Volume, Projected Volume at time, Volatility Projection Cone, Moving Average Cross, Guppy Multiple Moving Average, Enhanced anchored VWAP.
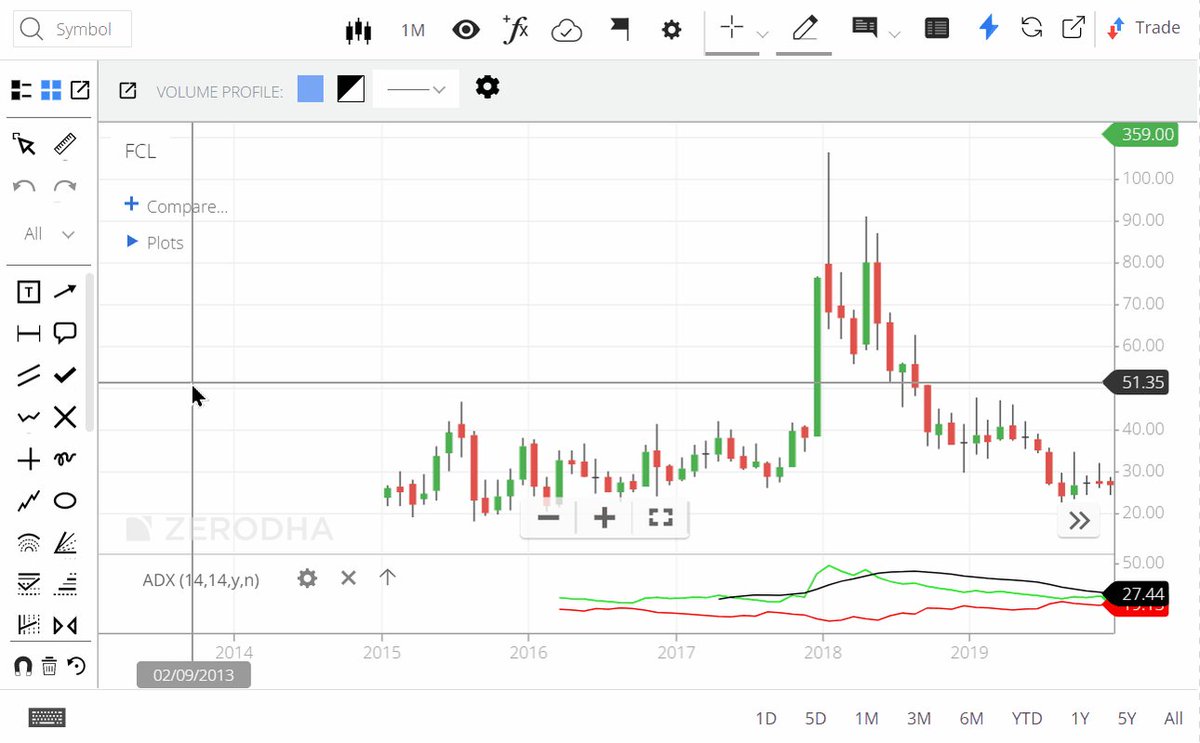
New drawings: Elliott wave, Magnet, Volume Profile by date range.
You can mark all your frequently used drawing tools as favourites and access them quickly at the top of the drawing tools menu.
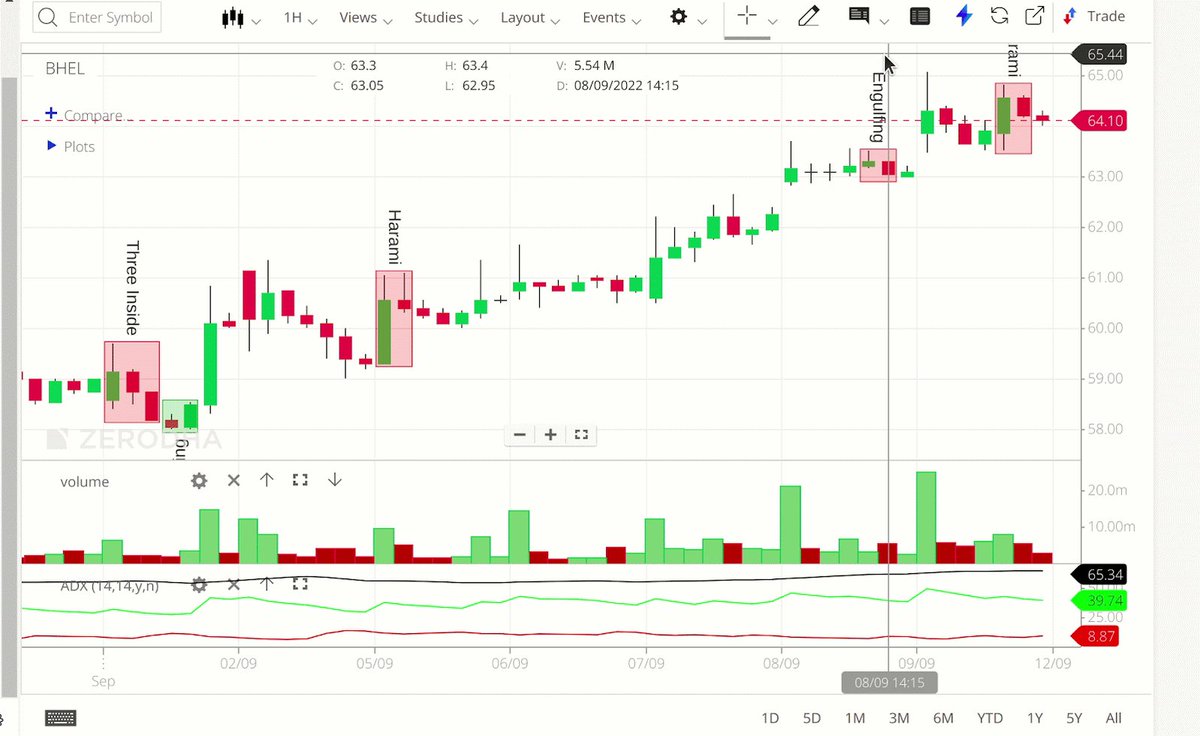
Using the Tool Tip feature you can now see historical indicators values along with open, high, low and close values (OHLC) in the info box.
If you have any feedback, let us know on @TradingQnA 👇
https://t.co/RyXUVdOYe4
More from Trading
You May Also Like
Curated the best tweets from the best traders who are exceptional at managing strangles.
• Positional Strangles
• Intraday Strangles
• Position Sizing
• How to do Adjustments
• Plenty of Examples
• When to avoid
• Exit Criteria
How to sell Strangles in weekly expiry as explained by boss himself. @Mitesh_Engr
• When to sell
• How to do Adjustments
• Exit
1. Let's start option selling learning.
— Mitesh Patel (@Mitesh_Engr) February 10, 2019
Strangle selling. ( I am doing mostly in weekly Bank Nifty)
When to sell? When VIX is below 15
Assume spot is at 27500
Sell 27100 PE & 27900 CE
say premium for both 50-50
If bank nifty will move in narrow range u will get profit from both.
Beautiful explanation on positional option selling by @Mitesh_Engr
Sir on how to sell low premium strangles yourself without paying anyone. This is a free mini course in
Few are selling 20-25 Rs positional option selling course.
— Mitesh Patel (@Mitesh_Engr) November 3, 2019
Nothing big deal in that.
For selling weekly option just identify last week low and high.
Now from that low and high keep 1-1.5% distance from strike.
And sell option on both side.
1/n
1st Live example of managing a strangle by Mitesh Sir. @Mitesh_Engr
• Sold Strangles 20% cap used
• Added 20% cap more when in profit
• Booked profitable leg and rolled up
• Kept rolling up profitable leg
• Booked loss in calls
• Sold only
Sold 29200 put and 30500 call
— Mitesh Patel (@Mitesh_Engr) April 12, 2019
Used 20% capital@44 each
2nd example by @Mitesh_Engr Sir on converting a directional trade into strangles. Option Sellers can use this for consistent profit.
• Identified a reversal and sold puts
• Puts decayed a lot
• When achieved 2% profit through puts then sold
Already giving more than 2% return in a week. Now I will prefer to sell 32500 call at 74 to make it strangle in equal ratio.
— Mitesh Patel (@Mitesh_Engr) February 7, 2020
To all. This is free learning for you. How to play option to make consistent return.
Stay tuned and learn it here free of cost. https://t.co/7J7LC86oW0