Price + Open Interest (OI) + Volume = Deadly Combo

There are many tools for Open Interest. Options Decoder from @TrueData2 is one of the simple yet powerful tools on options and OI.

Below are the 10 Powerful Features of Options Decoder

Thread ๐Ÿงต๐Ÿงต

(1/N)

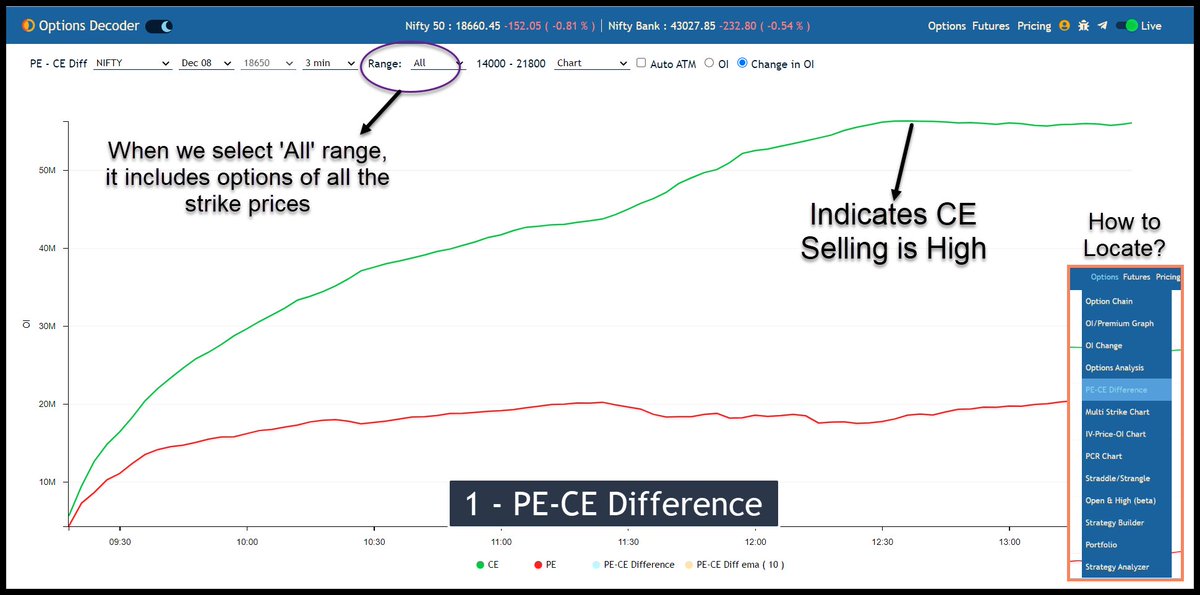
#1 - PE CE Difference

This feature combines the OI of call options and put options and plots against each other.

At one glance, we can know what big players are doing!

(If they are selling more CE means, they are bearish on the underlying instrument)

(2/N)
#2 - Advance/Decline

This feature displays all the F&O stocks in one place.

In one click, we can see the stocks in any order (like an increase in price, increase in OI, or decrease in volume, etc).

A highly useful feature for options traders!

(3/N)
#3 - Open High

This feature displays all the strike prices that have an open high (or open low) for the selected instrument.

If many CE strikes show "Open Low", then the market is bullish!

(4/N)
#4 - IV Price-OI Chart

This feature plots CE and PE vs. Open Interest (OI) for the ATM strike price.

Always Remember:

CE Long Build Up + PE Short Build Up = BULLISH

PE Long Build Up + CE Short Build Up = BEARISH

CE Short Build Up + PE Short Build Up = SIDEWAYS

(5/N)
#5 - Future Analysis

This feature provides the future price and open interest interpretation (like long buildup, short buildup, long unwinding, etc)

(6/N)
#6 - Future Chart

This feature plots future prices along with VWAP and OI Change.

A highly beneficial feature for intraday traders!

(7/N) #trading
#7 - Options Chain

Traders don't need any introduction for this feature.

It provides all the options greeks info along with OI and volume here.

(8/N) #OptionsTrading
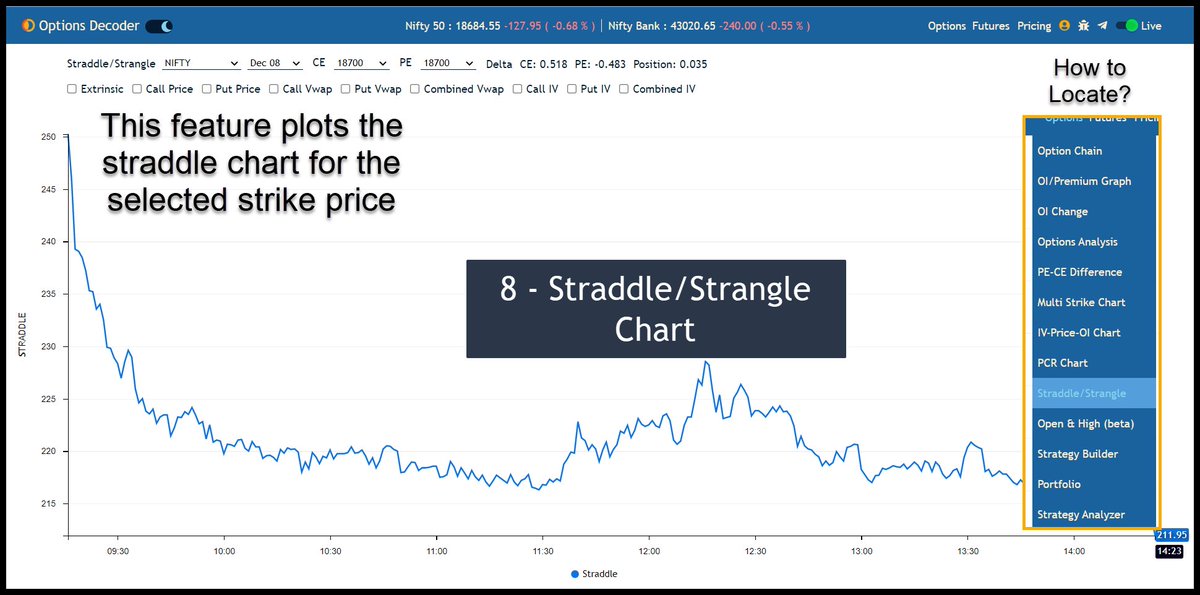
#8 - Straddle/Strangle Chart

Nowadays, most options traders deploy either a straddle or strangle strategy as part of their trading.

This is beneficial for them!

(9/N) #Straddle
#9 - OI Premium Graph

This feature plots cumulative OI and Change in OI for the selected instrument.

Highly beneficial for both option buyers and option sellers!

(10/N)
#10 - Weekly/Monthly OI

This feature explains price-open interest interpretation on a weekly/monthly basis.

(11/N)
If you are new to open interest (OI), then read this article to learn how to use it in intraday/options trading.

https://t.co/drugZ6xv8K

(12/N)
If you like this useful information, please #retweet and share it with your friends ๐Ÿ˜ƒ๐Ÿ˜ƒ

Follow me
@indraziths

You can also read my book on Intraday Trading.

https://t.co/dnDrkXDZ7p

More from Indrazith Shantharaj

More from Trading

TradingView isn't just charts

It's much more powerful than you think

9 things TradingView can do, you'll wish you knew yesterday: ๐Ÿงต

Collaborated with @niki_poojary

1/ Free Multi Timeframe Analysis

Step 1. Download Vivaldi Browser

Step 2. Login to trading view

Step 3. Open bank nifty chart in 4 separate windows

Step 4. Click on the first tab and shift + click by mouse on the last tab.

Step 5. Select "Tile all 4 tabs"


What happens is you get 4 charts joint on one screen.

Refer to the attached picture.

The best part about this is this is absolutely free to do.

Also, do note:

I do not have the paid version of trading view.


2/ Free Multiple Watchlists

Go through this informative thread where @sarosijghosh teaches you how to create multiple free watchlists in the free


3/ Free Segregation into different headers/sectors

You can create multiple sections sector-wise for free.

1. Long tap on any index/stock and click on "Add section above."
2. Secgregate the stocks/indices based on where they belong.

Kinda like how I did in the picture below.
๐—ก๐—ถ๐—ณ๐˜๐˜†-๐—•๐—ฎ๐—ป๐—ธ๐—ป๐—ถ๐—ณ๐˜๐˜† ๐—ข๐—ฝ๐˜๐—ถ๐—ผ๐—ป ๐—•๐˜‚๐˜†๐—ถ๐—ป๐—ด ๐—ฆ๐˜๐—ฟ๐—ฎ๐˜๐—ฒ๐—ด๐˜†

Complete Backtest and Indicator link

๐Ÿงต A Thread ๐Ÿงต

๐—ฆ๐—ฒ๐˜๐˜‚๐—ฝ:
๐Ÿ”ธ Monthly Option Buying
๐Ÿ”ธ 50 ema on 3 min timeframe
๐Ÿ”ธ Supertrend 10 , 3
๐Ÿ”ธ Chart : Banknifty , Nifty Futures as we backtested on futures
๐Ÿ”ธ Entry 9:20 to 3:00
๐Ÿ”ธ Max 3 Entries per day
๐Ÿ”ธ Premium nearest to 200 Rs only

[2/18]

Why Monthly Option buying ?
๐Ÿ”ธ Less theta decay compared to weekly options
๐Ÿ”ธ Less Volatility
๐Ÿ”ธ Supertrend and MA Settings
[3/18]


๐Ÿ”ธ Indicator Link
๐Ÿ”ธ Click on the below ๐˜ญ๐˜ช๐˜ฏ๐˜ฌ -> ๐˜ˆ๐˜ฅ๐˜ฅ ๐˜ต๐˜ฐ ๐˜๐˜ข๐˜ท๐˜ฐ๐˜ถ๐˜ณ๐˜ช๐˜ต๐˜ฆ๐˜ด -> ๐˜ˆ๐˜ฅ๐˜ฅ ๐˜ฐ๐˜ฏ ๐˜Š๐˜ฉ๐˜ข๐˜ณ๐˜ต from favourites and start using it !

๐Ÿ”ธ
https://t.co/zVXavqLBto
[4/18]

๐—œ๐—ป๐—ฑ๐—ถ๐—ฐ๐—ฎ๐˜๐—ผ๐—ฟ ๐—ฆ๐—ฒ๐˜๐˜๐—ถ๐—ป๐—ด๐˜€ :
๐Ÿ”ธ Max 6 Trades per day ( Both CE and PE buy)
๐Ÿ”ธ Timings 9:20 am to 3:00 pm
๐Ÿ”ธ Supertrend : 10,3
๐Ÿ”ธ Moving Average 50 ema
[5/18]

You May Also Like