Day trading offers many trading opportunities to make quick money.
But if there is no trade opportunity in Nifty/Banknifty, then what to do?
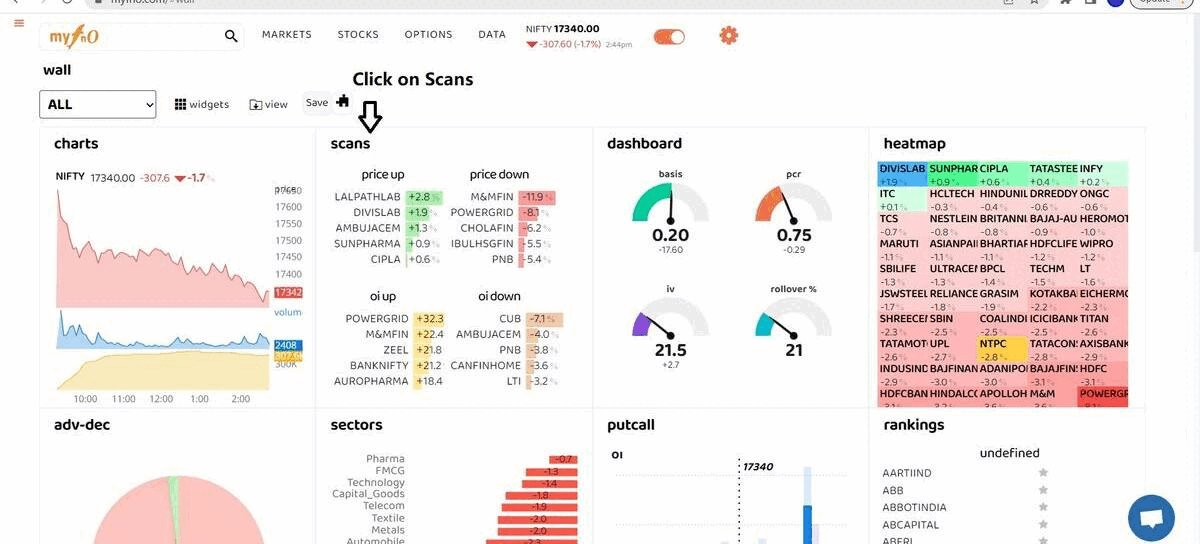
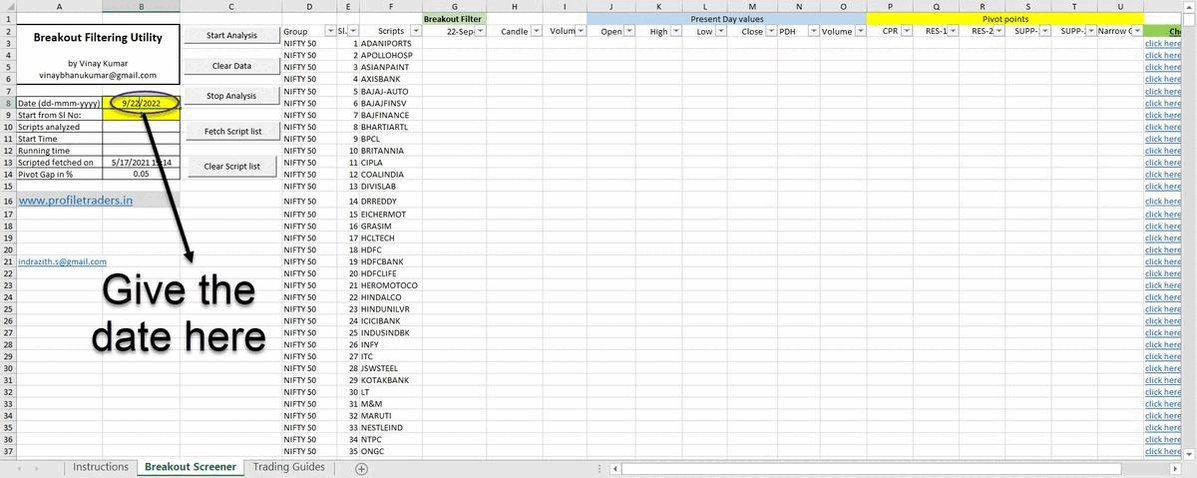
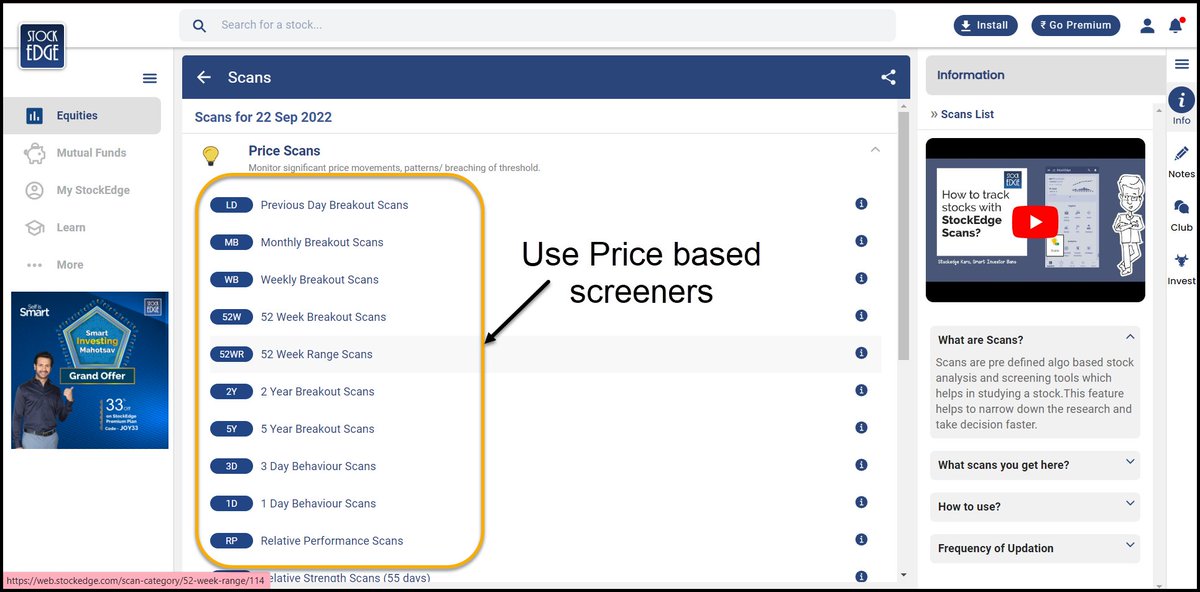
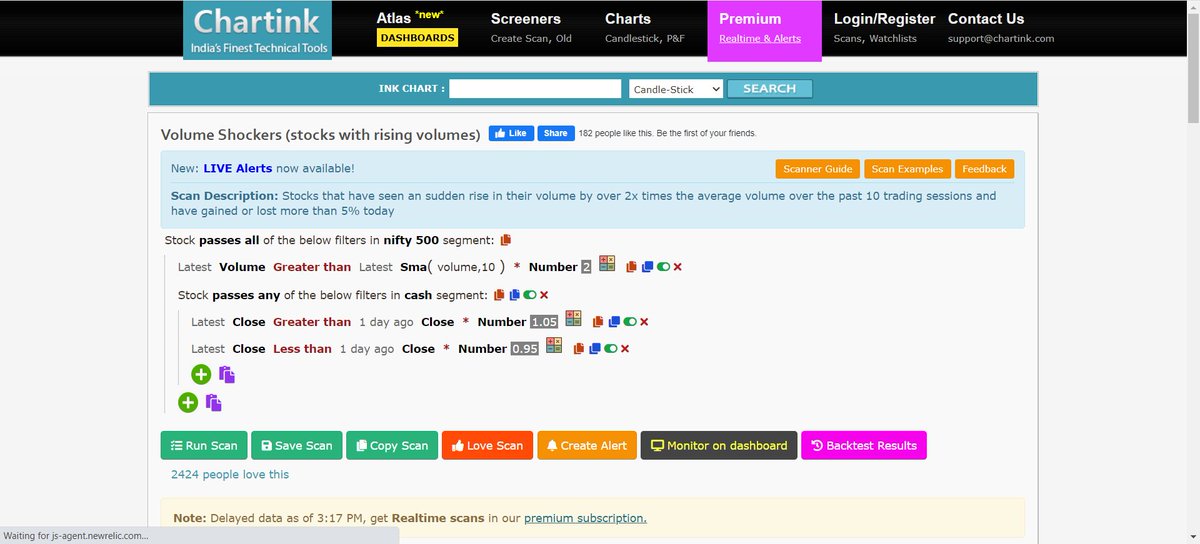
How to shortlist stocks for intraday trading? there are some simple
More from Indrazith Shantharaj
4 factors to measure the performance of a trading system:
1 - Accuracy
There is no such thing as 90% Accuracy without compromising on other factors (like profit factor, etc)
Fact - A good trading system will have only 35-60% accuracy without compromising other factors.
(1/n)
2 - Profit Factor (PF)
It is similar to risk-reward. It is derived using the below formula:
Profit Factor = Total Profit by winning trades / Total loss by losing trades
Fact - A trading system above 1.2 PF is good if it scores well with other factors.
(2/n)
3 - Maximum Drawdown
The maximum drawdown also plays a vital role psychologically while picking a trading system.
Fact - Maximum Drawdown in any trading system should not exceed 20%. I suggest picking only the techniques which have less than 10% maximum drawdown.
(3/n)
4 - Maximum Consecutive Losers
We all feel bad even if we lose only Rs.1,000 in a trade. Because it is not only about the money, it is emotionally difficult to accept the failure.
Fact - A good trading system will have less than 15 consecutive losing trades.
(4/n)
TRADE LIKE CRAZY
10 Profitable Intraday Trading Systems, which are backtested against 10-years of Banknifty Historical Data!
(n/n)
https://t.co/BuUie17Ish
1 - Accuracy
There is no such thing as 90% Accuracy without compromising on other factors (like profit factor, etc)
Fact - A good trading system will have only 35-60% accuracy without compromising other factors.
(1/n)
2 - Profit Factor (PF)
It is similar to risk-reward. It is derived using the below formula:
Profit Factor = Total Profit by winning trades / Total loss by losing trades
Fact - A trading system above 1.2 PF is good if it scores well with other factors.
(2/n)
3 - Maximum Drawdown
The maximum drawdown also plays a vital role psychologically while picking a trading system.
Fact - Maximum Drawdown in any trading system should not exceed 20%. I suggest picking only the techniques which have less than 10% maximum drawdown.
(3/n)
4 - Maximum Consecutive Losers
We all feel bad even if we lose only Rs.1,000 in a trade. Because it is not only about the money, it is emotionally difficult to accept the failure.
Fact - A good trading system will have less than 15 consecutive losing trades.
(4/n)
TRADE LIKE CRAZY
10 Profitable Intraday Trading Systems, which are backtested against 10-years of Banknifty Historical Data!
(n/n)
https://t.co/BuUie17Ish
"VOLUME is the ultimate Trading cheat code" PART 2
Please read the FIRST Thread Before Reading this!
https://t.co/IV1HrDlzqk
#StockMarket #stock #volumeintrading
#1 Volume Color Can Create a False Illusion
At first look, it looks like a big volume spike.
But if you notice the price candle, it has a big selling wick.
It indicates "SELLING PRESSURE" is high at that time.
We can easily avoid this false impression using the "BLACK" color code across all the volume bars.
Now your mind doesn't assume it is a bullish volume spike!
(If you don't want to use the black color, then view the chart without getting any bias based on the volume color)
#2 Analyze Each Volume Spike Carefully
In this image, the price is breaking the resistance trendline.
How do you say whether it is a genuine breakout or false breakout (from a volume perspective)?
Observe the major Volume Spikes.
A is Bullish (Price moved upside on the next day)
B is Bearish (Price fell on the next day)
C is Bearish (Price moved sideways and fell)
D is Bearish (Price fell on the next day)
So High Probability of FALSE BREAKOUT!
Please read the FIRST Thread Before Reading this!
https://t.co/IV1HrDlzqk
#StockMarket #stock #volumeintrading
VOLUME is the ultimate Trading cheat code.
— Indrazith Shantharaj (@indraziths) August 6, 2022
But, most people never use it in the right way \u2013 because no one ever taught them how.
Here are 10 psychological triggers to knowing Volume in a better way :
#1 Volume Color Can Create a False Illusion
At first look, it looks like a big volume spike.
But if you notice the price candle, it has a big selling wick.
It indicates "SELLING PRESSURE" is high at that time.
We can easily avoid this false impression using the "BLACK" color code across all the volume bars.
Now your mind doesn't assume it is a bullish volume spike!
(If you don't want to use the black color, then view the chart without getting any bias based on the volume color)
#2 Analyze Each Volume Spike Carefully
In this image, the price is breaking the resistance trendline.
How do you say whether it is a genuine breakout or false breakout (from a volume perspective)?
Observe the major Volume Spikes.
A is Bullish (Price moved upside on the next day)
B is Bearish (Price fell on the next day)
C is Bearish (Price moved sideways and fell)
D is Bearish (Price fell on the next day)
So High Probability of FALSE BREAKOUT!
More from Screeners
So friends here is the thread on the recommended pathway for new entrants in the stock market.
Here I will share what I believe are essentials for anybody who is interested in stock markets and the resources to learn them, its from my experience and by no means exhaustive..
First the very basic : The Dow theory, Everybody must have basic understanding of it and must learn to observe High Highs, Higher Lows, Lower Highs and Lowers lows on charts and their
Even those who are more inclined towards fundamental side can also benefit from Dow theory, as it can hint start & end of Bull/Bear runs thereby indication entry and exits.
Next basic is Wyckoff's Theory. It tells how accumulation and distribution happens with regularity and how the market actually
Dow theory is old but
Here I will share what I believe are essentials for anybody who is interested in stock markets and the resources to learn them, its from my experience and by no means exhaustive..
First the very basic : The Dow theory, Everybody must have basic understanding of it and must learn to observe High Highs, Higher Lows, Lower Highs and Lowers lows on charts and their
Even those who are more inclined towards fundamental side can also benefit from Dow theory, as it can hint start & end of Bull/Bear runs thereby indication entry and exits.
Next basic is Wyckoff's Theory. It tells how accumulation and distribution happens with regularity and how the market actually
Dow theory is old but
Old is Gold....
— Professor (@DillikiBiili) January 23, 2020
this Bharti Airtel chart is a true copy of the Wyckoff Pattern propounded in 1931....... pic.twitter.com/tQ1PNebq7d
You May Also Like
The entire discussion around Facebook’s disclosures of what happened in 2016 is very frustrating. No exec stopped any investigations, but there were a lot of heated discussions about what to publish and when.
In the spring and summer of 2016, as reported by the Times, activity we traced to GRU was reported to the FBI. This was the standard model of interaction companies used for nation-state attacks against likely US targeted.
In the Spring of 2017, after a deep dive into the Fake News phenomena, the security team wanted to publish an update that covered what we had learned. At this point, we didn’t have any advertising content or the big IRA cluster, but we did know about the GRU model.
This report when through dozens of edits as different equities were represented. I did not have any meetings with Sheryl on the paper, but I can’t speak to whether she was in the loop with my higher-ups.
In the end, the difficult question of attribution was settled by us pointing to the DNI report instead of saying Russia or GRU directly. In my pre-briefs with members of Congress, I made it clear that we believed this action was GRU.
The story doesn\u2019t say you were told not to... it says you did so without approval and they tried to obfuscate what you found. Is that true?
— Sarah Frier (@sarahfrier) November 15, 2018
In the spring and summer of 2016, as reported by the Times, activity we traced to GRU was reported to the FBI. This was the standard model of interaction companies used for nation-state attacks against likely US targeted.
In the Spring of 2017, after a deep dive into the Fake News phenomena, the security team wanted to publish an update that covered what we had learned. At this point, we didn’t have any advertising content or the big IRA cluster, but we did know about the GRU model.
This report when through dozens of edits as different equities were represented. I did not have any meetings with Sheryl on the paper, but I can’t speak to whether she was in the loop with my higher-ups.
In the end, the difficult question of attribution was settled by us pointing to the DNI report instead of saying Russia or GRU directly. In my pre-briefs with members of Congress, I made it clear that we believed this action was GRU.